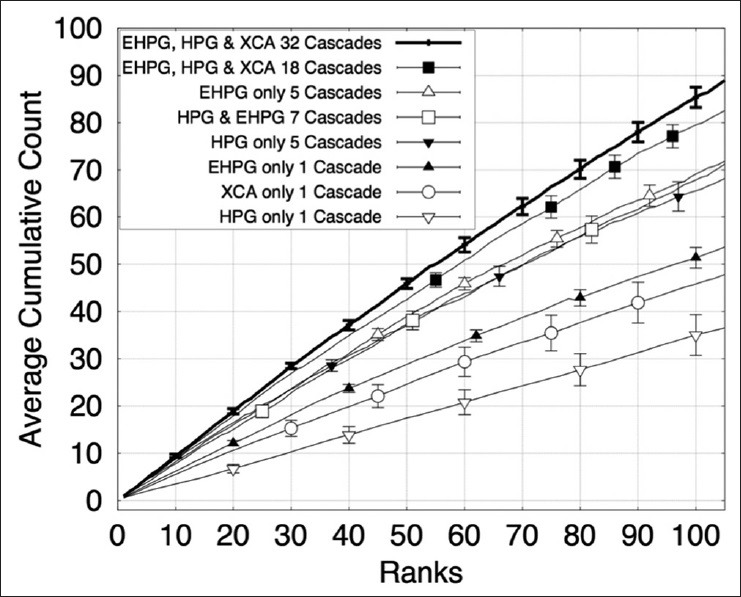
Figure 2.

The plot shows the cumulative counts averaged over nine images versus ranks for prominent nucleoli patterns detected in the renal clear cell cancer dataset with error bars representing the standard error of the mean. We compared our result using different classifier combinations in our cascade and different numbers of cascades. HPG: Histogram of Polar Gradient classifier. EHPG: Extended Histogram of Polar Gradient classifier. XCA: eXclusive component analysis classifier
