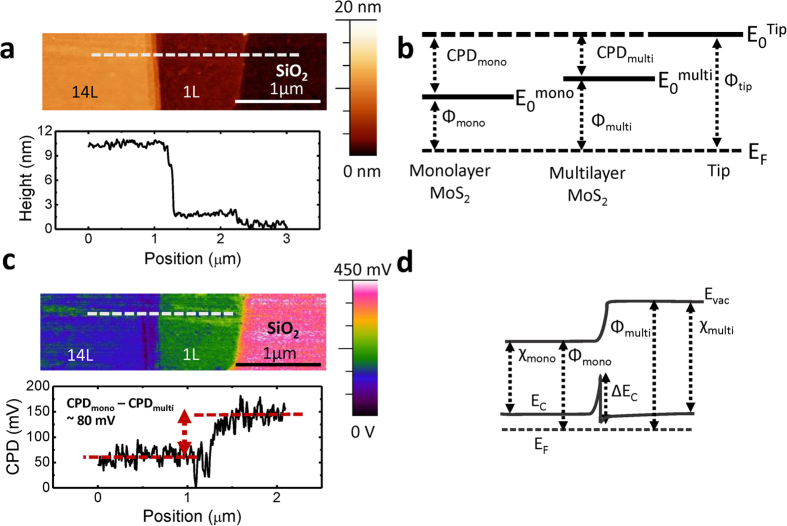
Figure 1.
a. Atomic Force Microscope (AFM) image of a monolayer-multilayer MoS2 flake. b. Representative energy band diagrams of isolated monolayer and multilayer MoS2 with respect to the AFM tip, depicting CPD and work function values. c. Kelvin Force Probe Microscope (KPFM) image of a representative 1L-14L MoS2 flake. d. Representative band diagram of a monolayer-multilayer device at equilibrium.

