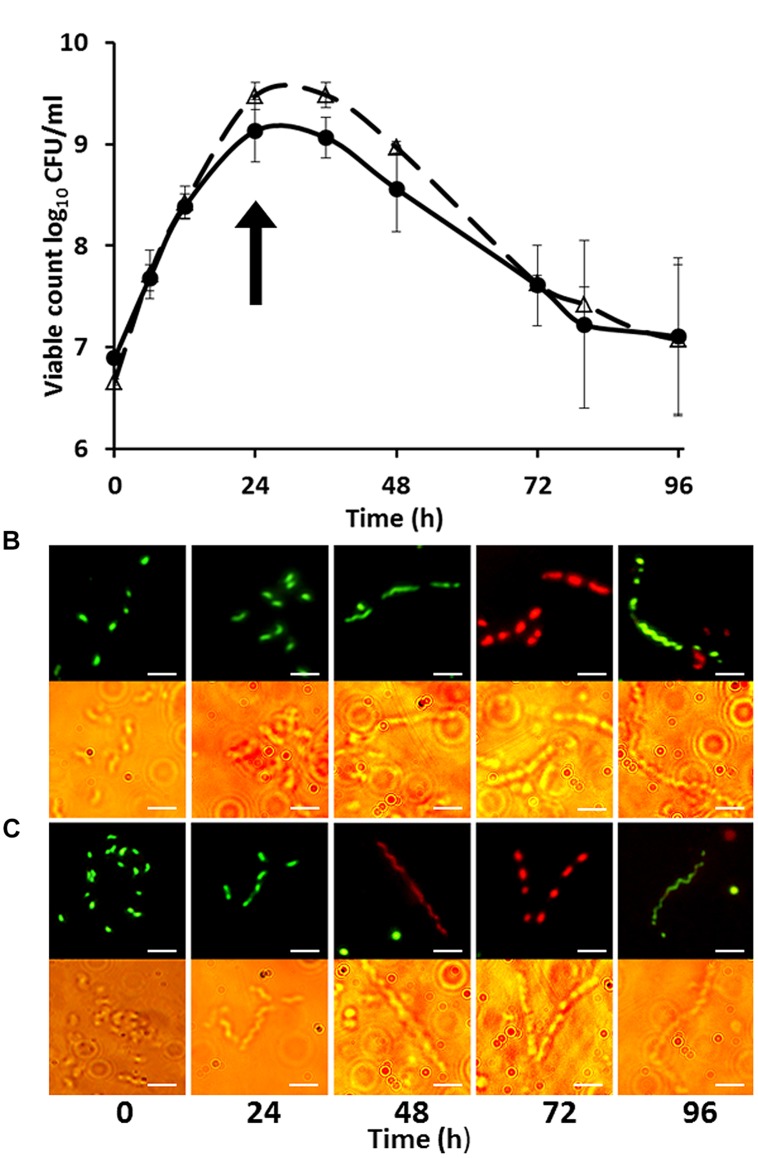
FIGURE 1.
Growth curves (A) of Campylobacter jejuni strains HPC5 (△) and HF5 (●) and morphological changes during growth of C. jejuni HPC5 (B), and HF5 (C) in NB2. Arrow in (A) indicates the time point at which the filamentous cells were first observed (on entry to stationary phase). Error bars are ±SD for n = 3. In (B) and (C) the upper row shows cells stained with fluorescent stains whilst the lower row shows bright field microscopy image of the same cells. Scale bar, 5 μm.

