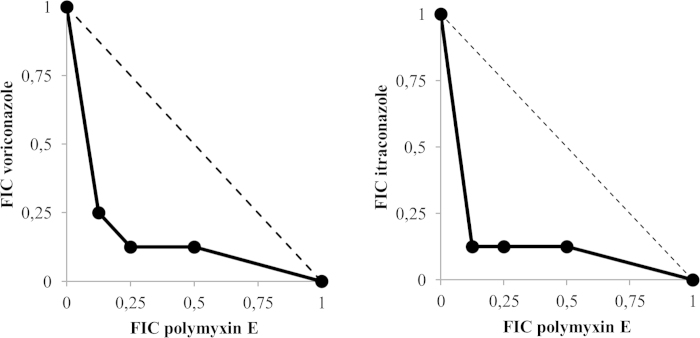
Figure 1. FIC Isobolograms showing the interactions between two antimicrobial agents in inhibiting Bsal growth.
FIC values derived from combinations of voriconazole, itraconazole and polymyxin E were used to plot the isobolograms. A FIC value of 1 corresponds to the MIC value of the particular antimicrobial agent. The dotted line represents the theoretical additive interaction between two agents (see text for our definition of the types of interactions).

