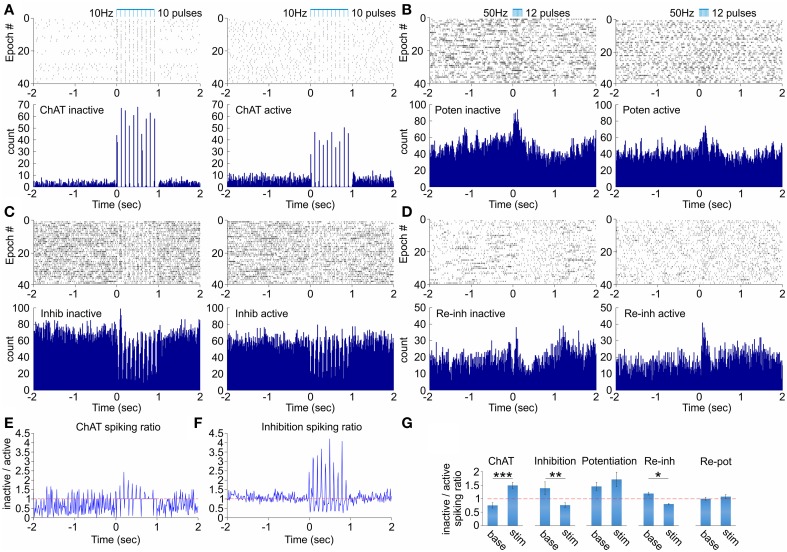
Figure 3.
Dependence of the septal network response on the behavioral state. (A) Raster plot and spike count of representative ChAT cell during inactive (left) and active (right) behavioral state after 10 Hz stimulation protocol. (B) Raster plot and spike count of representative potentiation cell during inactive (left) and active (right) behavioral state after 50 Hz stimulation protocol. (C) Raster plot and spike count of representative inhibition cell during inactive (left) and active (right) behavioral state after 10 Hz stimulation protocol. (D) Raster plot and spike count of representative re-inhibition cell during inactive (left) and active (right) behavioral state after 50 Hz stimulation protocol. (E) Ratio of the spiking firing rate for inactive over active behavioral state for the ChAT unit shown in (A). (F) Ratio of the spiking firing rate for inactive over active behavioral state for the inhibition unit shown in (C). (G) Ratios of the spiking firing rate for inactive over active behavioral state for baseline background activity (left) and stimulation-induced spiking (right) for ChAT, inhibition, potentiation, re-inhibition, and re-potentiation groups. Error bars represent ± sem, paired t-test; *P < 0.05, **P < 0.01, ***P < 0.001. The horizontal red dotted line indicates the ratio level of 1.

