Figure 5.
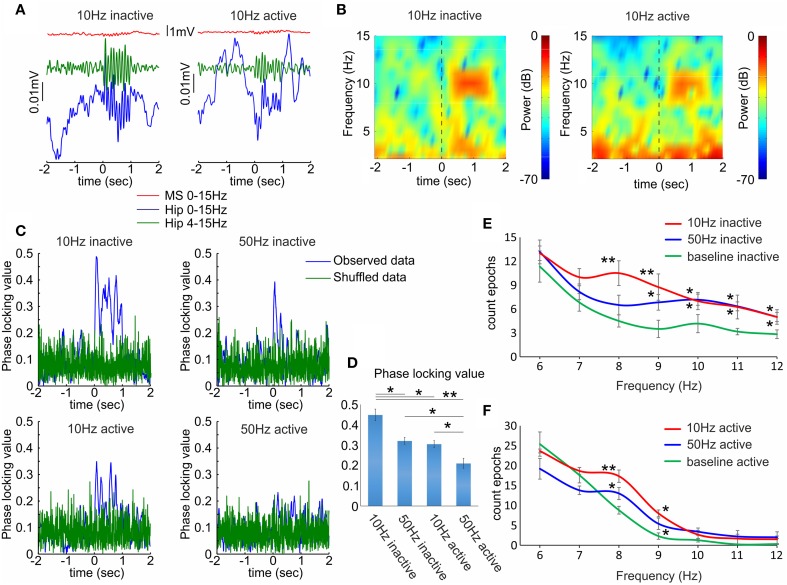
Hippocampal local field responses after septal ChAT stimulation. (A) Sample event related potentials (ERP) recorded in dorsal CA1 after 10 Hz septal optogenetic stimulation during inactive (left) and active (right) behavioral state. Upper red traces show ERP from medial septum, middle green traces represent ERP from hippocampus band-pass filtered (4–15 Hz) and lower blue traces represent the same hippocampal ERP after low-pass filtered (0–15 Hz). Time 0 indicates the delivery of the first train of 10 Hz stimulation protocol to medial septum. (B) Color-coded power spectrograms of hippocampal low-frequency oscillations after 10 Hz septal stimulation protocol during inactive (left) and active (right) behavioral state. Vertical dotted black line indicates time 0. (C) Representative samples of phase-locking value for 10 Hz inactive (top, left), 50 Hz inactive (top, right), 10 Hz active (below, left), and 50 Hz active (below, right) state. Blue traces show the observed data, while the green values represent shuffled data. (D) Average values of the phase-locking value for the same groups. Error bars represent ± sem, two-tailed t-test; *P < 0.05, **P < 0.01. (E) Frequency histogram of band-passed local field potential for 10 Hz (red), 50 Hz (blue) and baseline epoch counts (green) during inactive behavioral states. (F) Frequency histogram of band-passed local field potential for 10 Hz, 50 Hz and baseline epoch counts during active behavioral states. Error bars represent ± sem, Newman–Keuls test, *P < 0.05.

