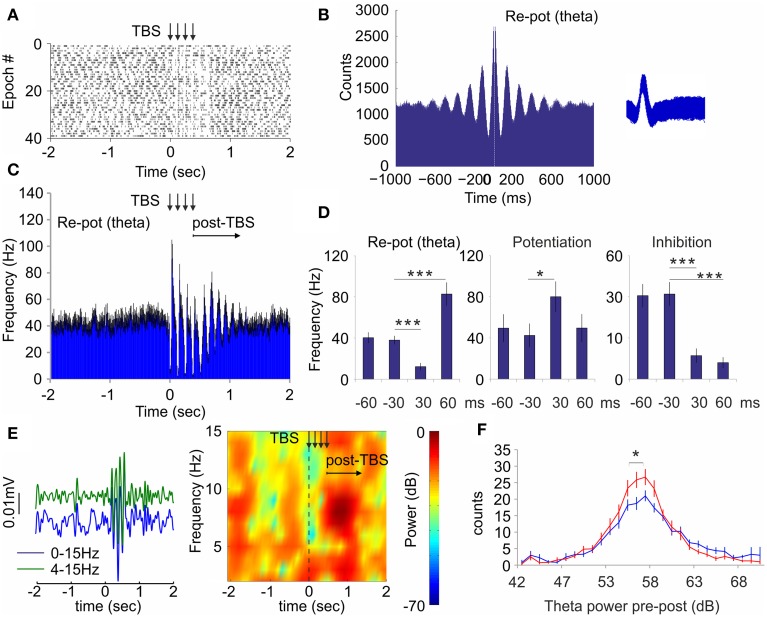
Figure 6.
Theta-burst stimulation of medial septum resets the spiking of hippocampal interneurons and theta oscillations. (A) Raster plot and spike count of representative re-potentiation hippocampal cell after electric theta-burst stimulation protocol (TBS, four bursts with inter-train interval of 100 Hz and inter-train interval of 8 Hz) to medial septum. Time 0 indicates the delivery of the first train. The vertical arrows indicate the delivery time of four trains. (B) Sample of 1000 ms autocorrelogram and spike waveform (right) of hippocampal theta unit. (C) Averaged frequency histogram for all theta cells. The vertical arrows indicate the delivery time of four trains. The horizontal arrow indicates the post-stimulation period. Black error bars represent ± sem. (D) Averaged firing frequency from −60 ms before to 60 ms after the first train for re-potentiated (theta), potentiated, and inhibited units, respectively. Error bars represent ± sem, Mann–Whitney test; *P < 0.05, ***P < 0.001. (E) Left: Sample band-pass filtered and low-pass filtered ERP recorded in dorsal CA1 after septal TBS. Right: Sample color-coded power spectrogram of the same recording. (F) Power histogram of hippocampal theta power before (blue) and after (red) TBS. Error bars represent ± sem, Two-Way ANOVA, *P < 0.05.

