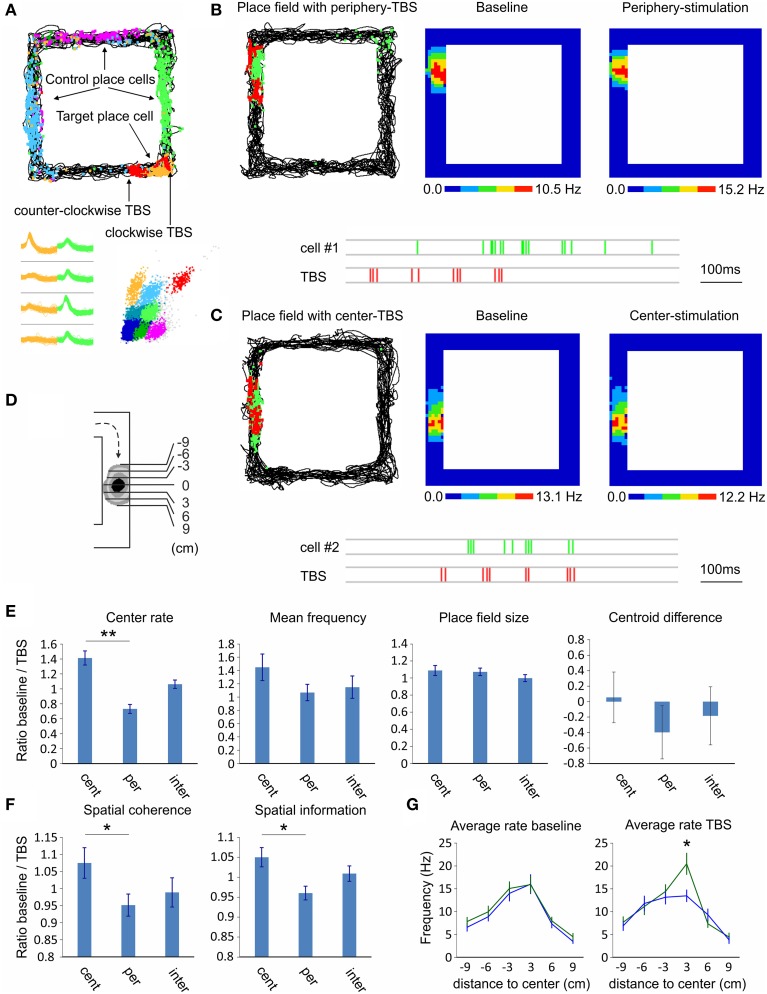
Figure 7.
Septal TBS effect on hippocampal place cells. (A) Sample place field maps of CA1 pyramidal neurons after exploration of rectangular-shaped linear track. The non-stimulated place cells (blue, purple, and green) are denoted as controls, while the target place cell (yellow) is stimulated with septal TBS (red). TBS pulses are positioned on each side of the field depending on the direction (clockwise and counter-clockwise) of the animal in the track. Bottom: spike waveforms and spike clusters of the same place cells. (B) Sample of periphery-stimulated place cell (cell #1); Left: map of animal trajectory with spikes (green) and TBS pulses (red). Firing rate maps during baseline (middle) and TBS session (right). Below: sample recording of the place cell spikes (green) and the preceding TBS pulses (red). (C) Sample of center-stimulated place cell (cell #2); map of animal trajectory with spikes (green) and TBS pulses (red). Note that the TBS pulses targeted the center of the place field in the course of clockwise direction. Firing rate maps during baseline (middle) and TBS session (right). Below: sample recording of the place cell spikes (green) and TBS pulses (red). (D) Scheme of place field binning for clockwise direction. (E) Comparison of the place field properties between TBS applied in the center of the place field (−3 to 0), in the periphery of the place field (−9 to −6), or intermediately (−6 to −3). Center rate, mean firing frequency, place field size and centroid difference (E), and spatial coherence and spatial information content (F) are represented as ratios of the measured values from baseline session over the values of the TBS session. (G) Average intra-field firing rate per 3 cm bins during baseline (left) and TBS (right) sessions, for periphery-stimulated (green) and center-stimulated (blue) place fields. Error bars represent ± sem, Newman–Keuls test; *P < 0.05, ** P < 0.01.

