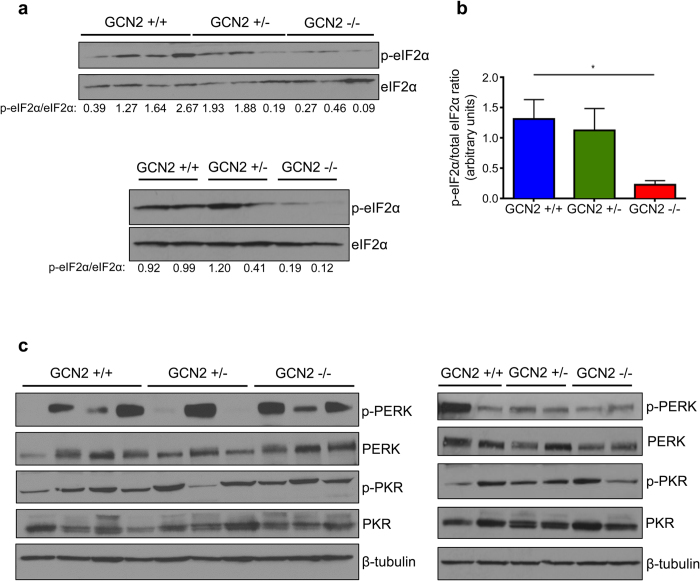
Figure 3. Loss of GCN2 reduces eIF2α phosphorylation in mixed background sarcomas.
(a) Western blot analysis on two independent samples of tumor homogenates for levels of phosphorylated and total eIF2α in mixed background tumors. The ratio of phosphorylated to total eIF2α is displayed below each blot. (b) Graphical representation of the phosphorylated to total eIF2α ratios calculated from the blots in (a). Data are represented as the average value for each genotype ± standard error of the mean; *p < 0.05. (c) Western blot analysis on two independent samples of tumor homogenates for levels of phosphorylated and total PERK and phosphorylated and total PKR in mixed background tumors. β-tubulin was used as a loading control.

