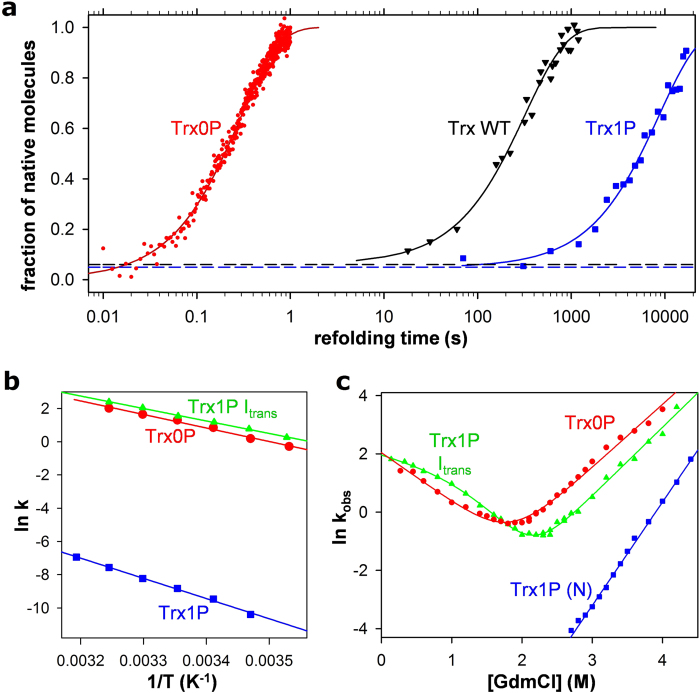
Figure 4. Folding kinetics of the oxidized forms of Trx WT, Trx0P, Trx1P and its trans-Pro76 intermediate (Itrans) at 25 °C and pH 7.0.
a: Kinetics of formation of N during refolding by dilution from 4.0 to 0.2 M GdmCl. Folding of Trx0Pox (red dots) was consistent with a two-state mechanism (cf. panel C). A monoexponential fit (solid line) yielded an apparent rate constant of folding of 3.49 ± 0.01 s−1. Formation of N during refolding of Trx WT and Trx1P was recorded with interrupted refolding experiments (cf. Fig. S3). Trx WT (black triangles) showed 6% fast folding molecules (black dotted line), and 94% of the molecules reached N at a single rate of 3.10 ± 0.18 · 10−3 s−1 (solid line). Trx1P (blue squares) showed 5% fast folders (blue dotted line), and the residual 95% folded very slowly with a single rate of 1.16 ± 0.15 · 10−4 s−1. The indicated errors are standard errors from monoexponential fits. b: Arrhenius plot for folding of Trx0P (red circles), formation of Itrans from unfolded Trx1P (green triangles), and formation of native Trx1P from Itrans (blue squares), yielding activation energies of 67.6 ± 3.2, 62.4 ± 1.4 and 101.0 ± 2.8 kJ mol−1, respectively. The indicated errors are standard errors from Arrhenius fits. c: Chevron Plots showing the dependence of the apparent rate constant of unfolding/refolding (kobs) on [GdmCl] for Trx0P (red circles) and Trx1P Itrans (green triangles). Data were fitted according to a two-state model of protein folding in the case of Trx0P (solid, red line). Unfolding/refolding of Itrans was evaluated according to a three-state model55 with a high-energy on-pathway intermediate (solid, green line) (see legend to Table 1 for the deduced kinetic parameters). The unfolding branch of Trx1P is shown for comparison.

