
Fig. 2.
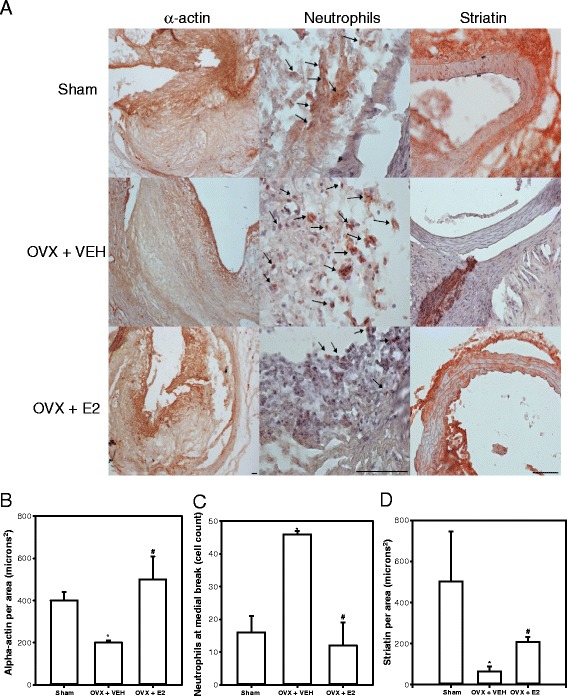
AAAs from Ovx females exhibit decreased α-actin, increased neutrophil content, and decreased striatin, which are reversed in AAAs from Ovx females administered E2. a Left, α-actin immunostaining in AAA tissue sections. a Middle, neutrophil cell counts in AAA sections from mice of each group. a Right, striatin immunostaining in AAA sections. Scale bar indicates 200 μm. b Quantification of α-actin immunostaining in AAA tissue sections (N = 5–6 sections/mouse/group; N = 3 mice/group). c Quantification of neutrophil cell counts in AAA tissue sections (N = 5–6 sections/mouse/group; N = 3 mice/group). d Quantification of striatin immunostaining in AAA tissue sections from mice of each group (N = 5–6 sections/mouse/group; N = 3 mice/group). For b–d, *P < 0.05 compared to sham. # P < 0.05 compared to Ovx vehicle