
Fig. 4.
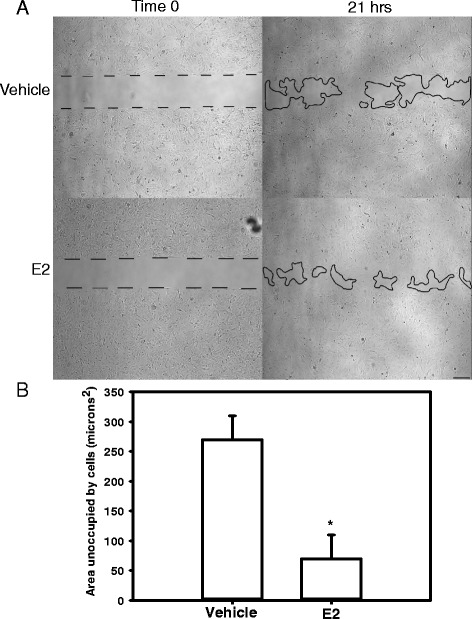
In abdominal aorta-derived SMC, E2 promoted wound healing. a Phase-contrast images (40×) for vehicle and E2-incubated cells (100 nM) at time 0 and 21 h. Dotted and solid black lines represent cell boundaries. Scale bar represents 100 μm. b Areas unoccupied by cells were summed, and averages for the two different incubations were quantified after 21–24 h. Asterisk represents a significant difference between groups