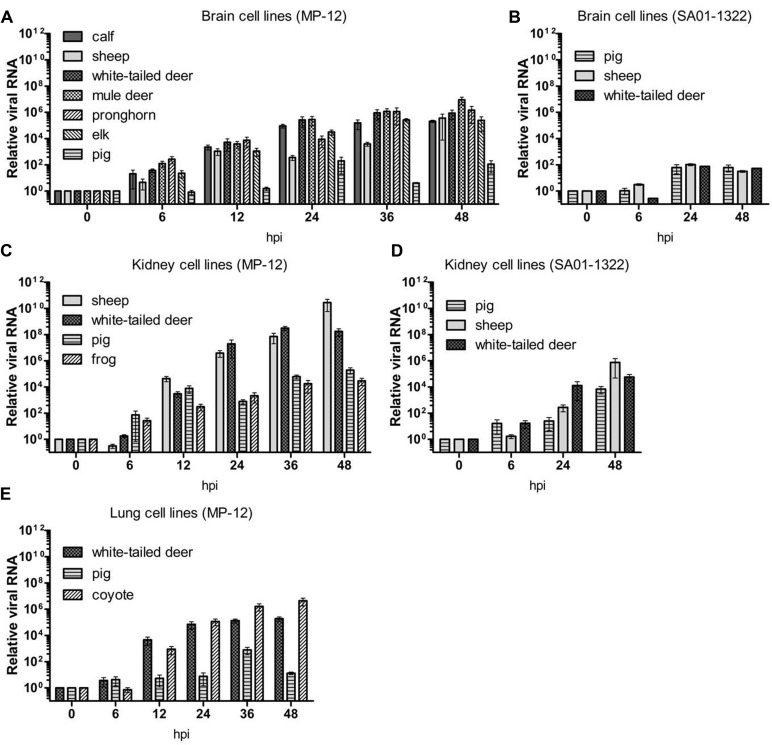
FIGURE 2.
Relative viral RNA levels in North American livestock and wildlife cell lines. Real time reverse transcription polymerase chain reaction (RT-PCR) was performed on time point samples from brain (A,B), kidney (C,D), and lung (E) cell lines infected with MP-12 (A,C,E) or SA01-1322 (B,D) strains. Expression of viral RNA was calculated relative to beta actin using the comparative Ct method. The mean of at least three biological replicates are represented with SEs.

