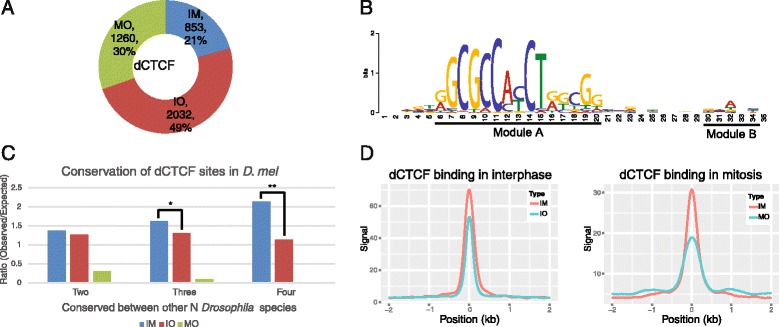
Fig. 1.

Characteristics of dCTCF-binding sites in interphase and mitosis. a Proportion of dCTCF-binding sites only in interphase (IO), mitosis (MO), or both (IM). b Analysis of motif enrichment of dCTCF-binding sites. c Obversed/Expected analysis of conserved dCTCF-binding sites. From left to right, bar plots show the ratio of the observed-to-expected number of conserved D. melanogaster specific binding events between at least N (2 ≤ N ≤ 4) Drosophila species (other species included D. simulans, D. yakuba, and D. pseudoobscura) (Fisher’s exact test, * p < 0.01, ** p < 0.0001). d Binding intensity of dCTCF-binding sites in interphase or mitosis. The x axes represent the distance from dCTCF-binding sites, and ‘0’ indicates the summit. Negative values indicate upstream and positive values indicate downstream of dCTCF-binding sites
