Fig. 3.

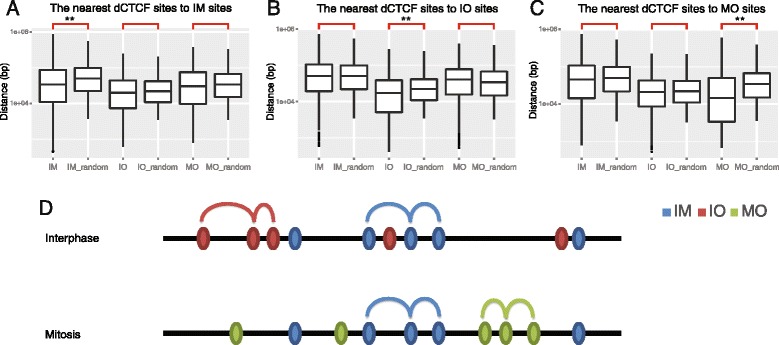
Non-random distributions of dCTCF-binding sites. a–c Shortest distances between specific dCTCF sites. Boxplots show the distribution of shortest distances between specific dCTCF sites; the suffix “_random” indicates control sets. Each panel (a, b, c) show the shortest distances of dCTCF sites to IM, IO, and MO sites, respectively. (Wilcoxon Test, ** p < 1e-8). d A proposed model of dCTCF loci in different phases of the cell cycle. Cell cycle phase specific dCTCF-binding sites of the same class were preferentially closer to one another, and appeared to establish cell cycle phase specific chromatin domains
