
Fig. 4.
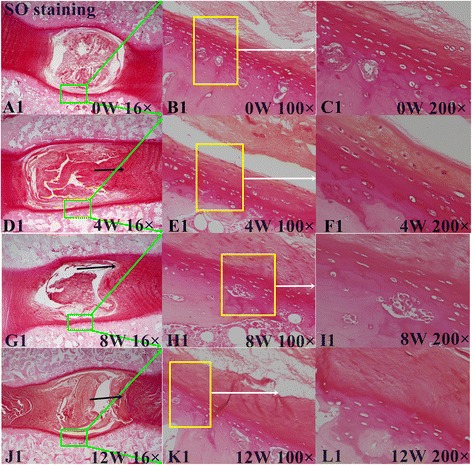
Safranin-O staining. a1, d1, g1, and j1 show the Safranin-O staining structure of the disc at 0, 4, 8 and 12 weeks. b-c show the Safranin-O staining structure of normal discs of different magnification (b 100×, c 200×). d1-l1 show the Safranin-O staining structure of the discs exhibiting a gradual degeneration at different time points. Black arrows show a misalignment of AF (anulus fibrous) in d1, g1, and j1,16 ×, and (e1, h1, and k1, 100 ×, f1, i1, and l1, 200 ×)