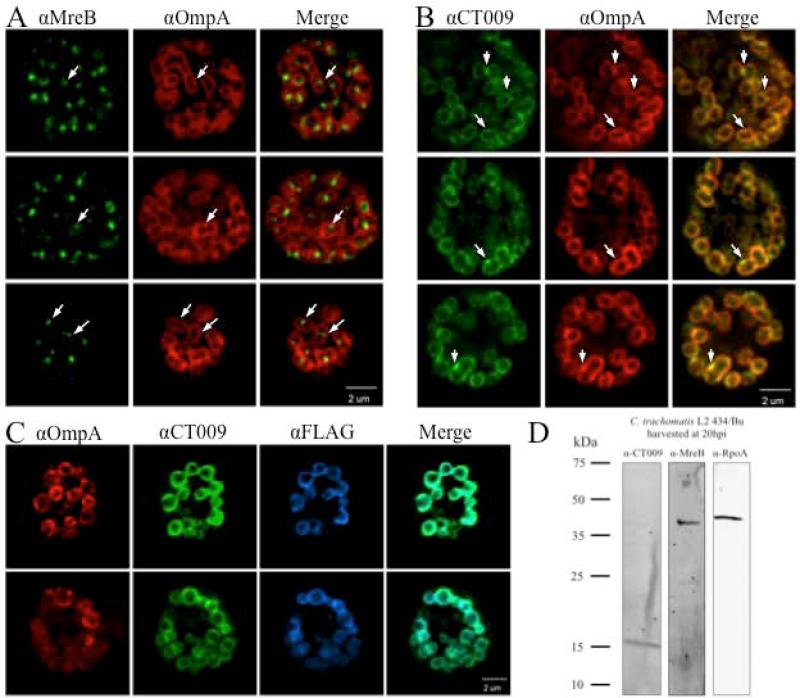
Figure 6. Localization of CT009 or MreB within C. trachomatis.
L929 cells infected with C. trachomatis L2 were fixed at 16 hpi and stained with affinity-purified antibodies and images acquired by confocal microscopy with 150× objective. Two or three representative inclusions are shown for
A. Anti-MreB (green), anti-OmpA (red), and merged image
B. Anti-CT009 (green), anti-OmpA (red), and merged image White arrows are highlighting potential sites for bacterial cell division.
C. Anti-OmpA (red), anti-CT009 (green), anti-FLAG (blue), and merged image of CT009 and FLAG
D. Monospecificity of CT009 and MreB antibodies. Expression levels of CT009, MreB and RpoA from C. trachomatis L2 434/Bu were analyzed at 20 hpi. Western blot was performed with affinity purified rabbit anti-CT009, rabbit anti-MreB, or rat anti-RpoA. Calculated MW of each protein are as follows: CT009, 16.2 kDa; MreB, 39.5 kDa; and RpoA, 41.8 kDa.

