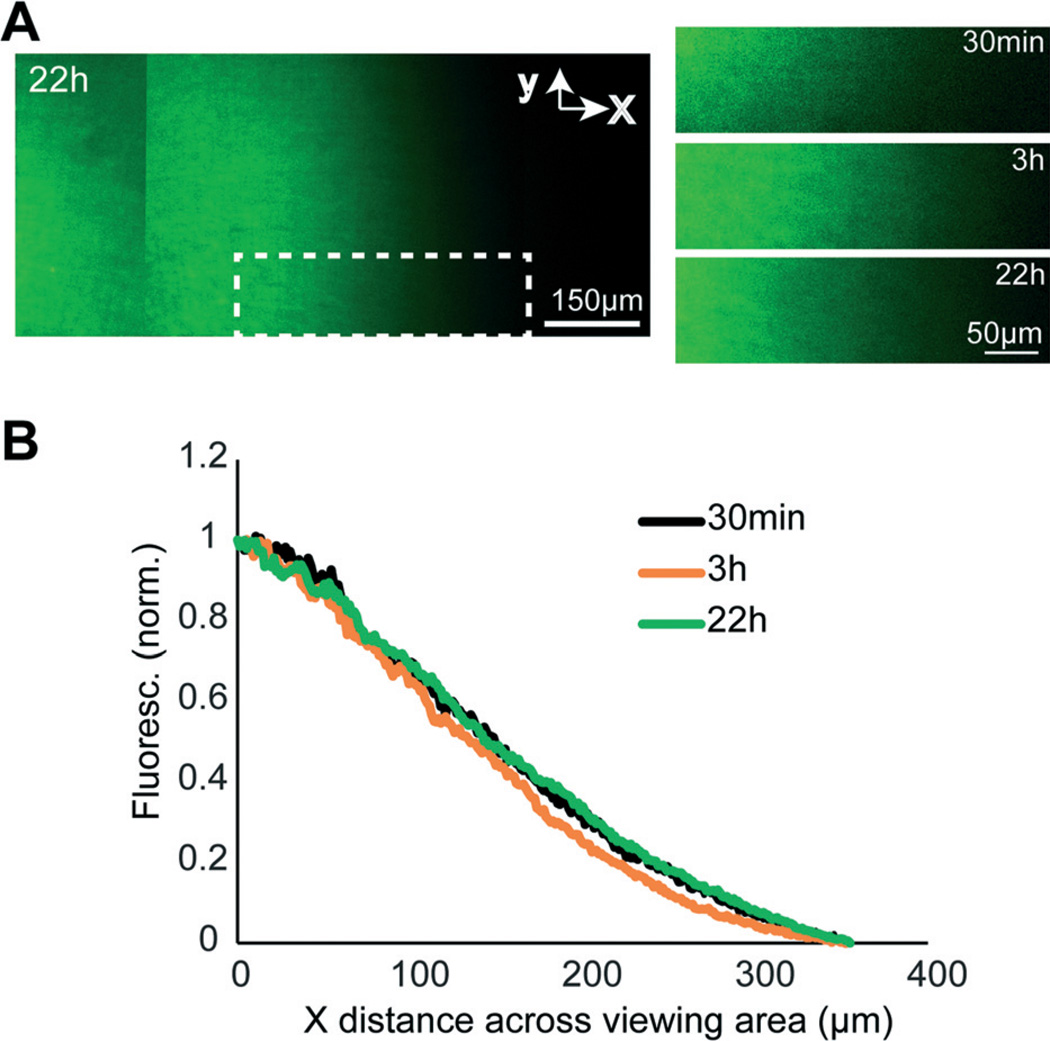
Fig. 2. Gradient stability.
(A) Montaged fluorescence images of the axon viewing area within a representative micro-pass gradient chamber 22 h after initiating a gradient using AlexaFluor dye (1 µM). The graphs on the right show the stability of gradient within the same white dashed region at different timepoints. (B) Gradient profiles within the white dashed region highlighted in (A) at 30 min, 3 h, and 24 h. Fluorescence intensity values were normalized to the maximum and minimum within the boxed region.

