Figure 7.
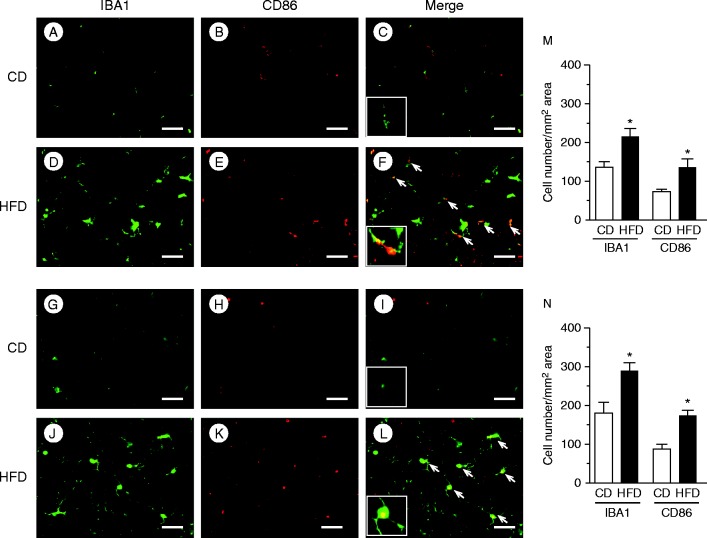
Immunohistochemical analyses of HFD-induced M1 macrophage accumulation in the nodose ganglion and hypothalamus. IBA1, CD86, and merged images of the nodose ganglion (A, B, C, D, E and F), and the hypothalamus (G, H, I, J, K and L) of CD- or HFD-fed mice. Arrows indicate co-localization of CD86 with IBA1. The insets in C, F, I and L are higher magnification examples of IBA1+/CD86+ cells. Numbers of cells stained with IBA1 or CD86 antibody in the nodose ganglion (M) and hypothalamus (N). Values are means±s.e.m. *P<0.05 versus CD. Scale bars, 50 μm.

 This work is licensed under a