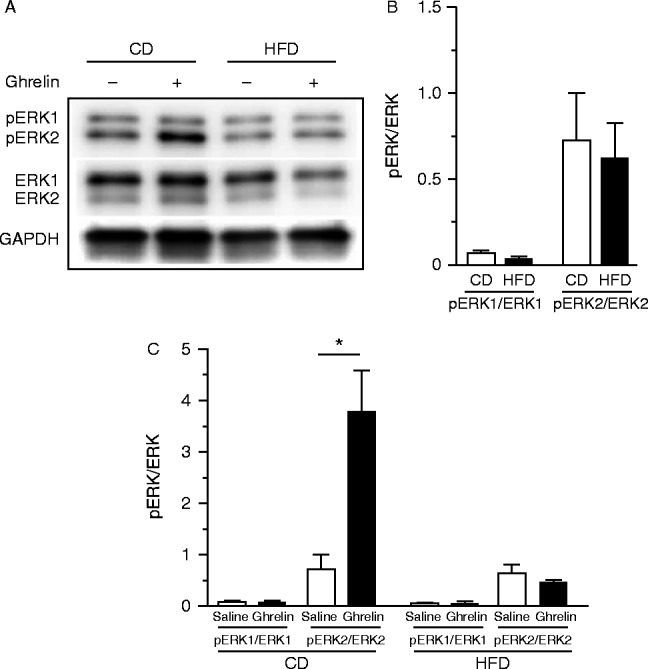
Figure 8.

Representative western blots for pERK1/2 and ERK1/2 in the nodose ganglia of CD- and HFD-fed mice (A). Levels of basal phosphorylation of ERK1 and ERK2 in the nodose ganglion of CD- and HFD-fed mice (B). Phosphorylated ERK1 and ERK2 in the nodose ganglion after s.c. administration of ghrelin (C). GAPDH was used as a control. Values are means±s.e.m. and represent the ratio of the intensity of bands corresponding to pERK1 and ERK1 or pERK2 and ERK2. *P<0.05 vs saline.

 This work is licensed under a