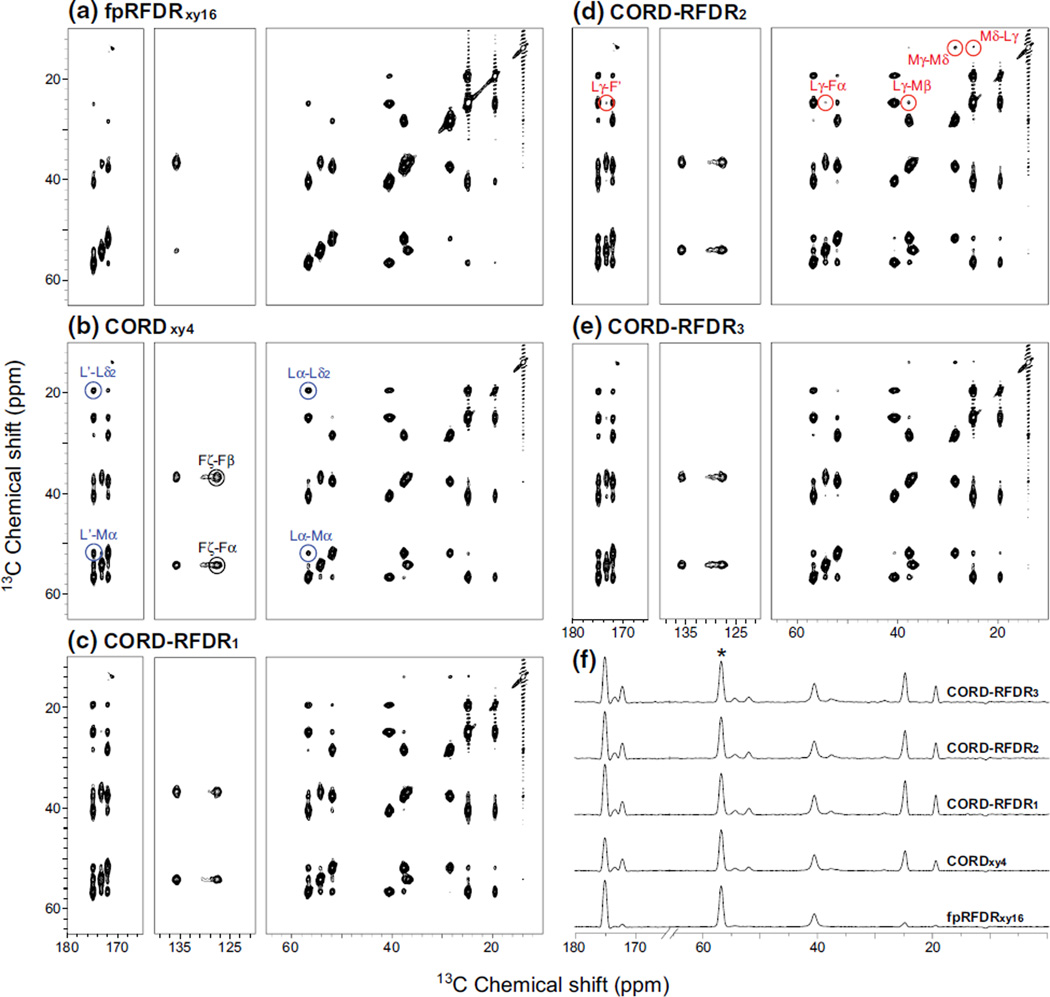
Fig. 3.
2D 13C–13C correlation NMR spectra of U-13C,15N-MLF tripeptide acquired with the following mixing sequences: a fpRFDRxy16, b CORDxy4, and c–e CORD–RFDR and its variants. f Comparison of the 1D traces extracted along the t2 dimension of the 2D spectra; the intensity was normalized to the Leu-Cα diagonal peak at 56.7 ppm. The spectra were recorded at the MAS frequency of 40 kHz and magnetic field of 14.1 T. The mixing times were 2.4, 500, 500/2.4, 1.2/500/1.2, and 250/2.4/250 ms respectively

