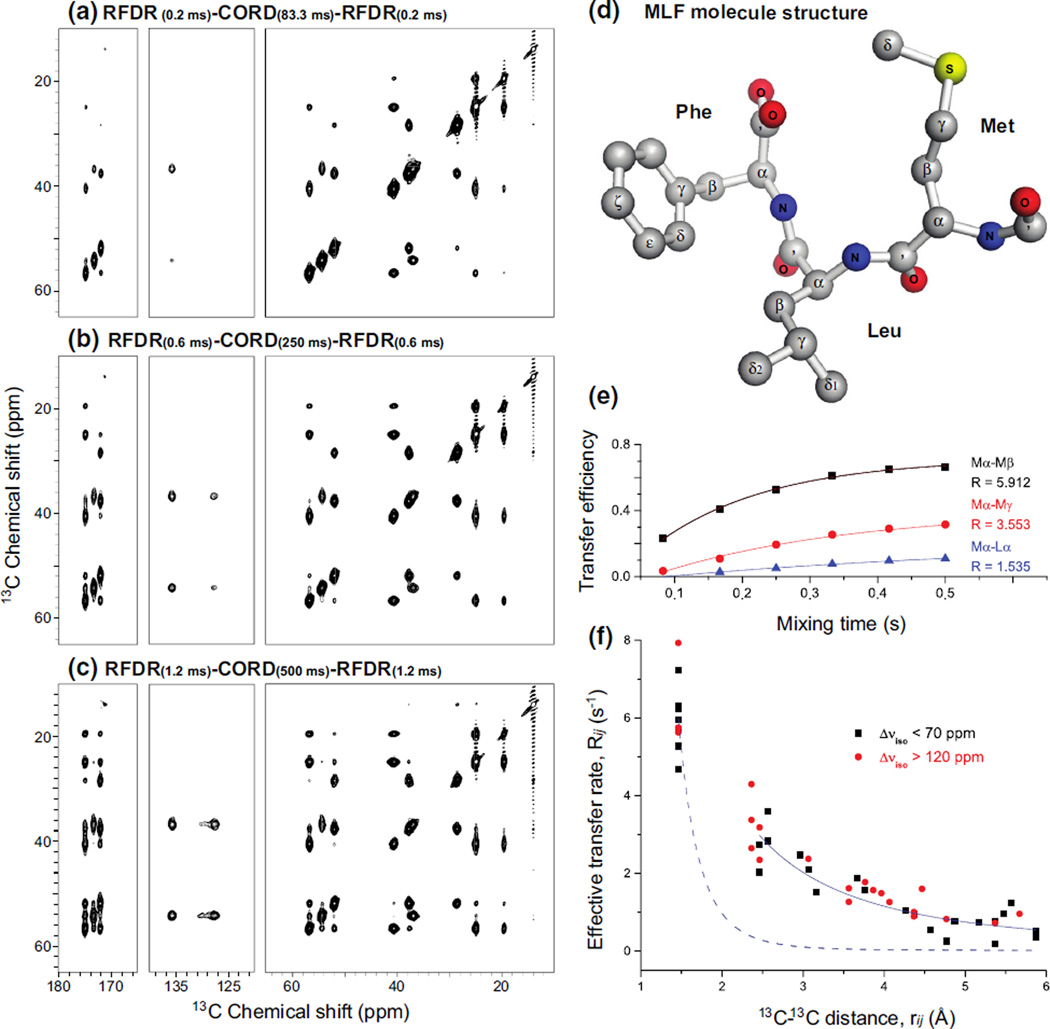
Fig. 4.
a–c 14.1 T 2D 13C–13C CORD–RFDR correlation NMR spectra of U-13C,15N-MLF tripeptide acquired with different fpRFDRxy16 and CORDxy4 mixing times. The MAS frequency was 40 kHz. d Molecular structure of MLF. e The transfer efficiencies for three representative 13C spin pairs plotted as a function of the mixing time. The transfer efficiency is defined as the ratio of twice the integrated intensity of the cross peak to the sum of integrated intensities of the corresponding diagonal peaks. f Effective polarization transfer rates plotted as a function of 13C–13C distances, from experimental CORD–RFDR data on MLF presented in Table 1. Effective polarization transfer rates for 13C-13C spin pairs with small and large chemical shifts difference are represented in black squares and red dots, respectively. A reference fitting for zero-quantum recoupling exhibiting the relationship is plotted as blue dashed curve. The empirical fitting of the experimental data to is plotted as solid blue curve, and corresponds to the contribution from the proton-assisted spin diffusion

