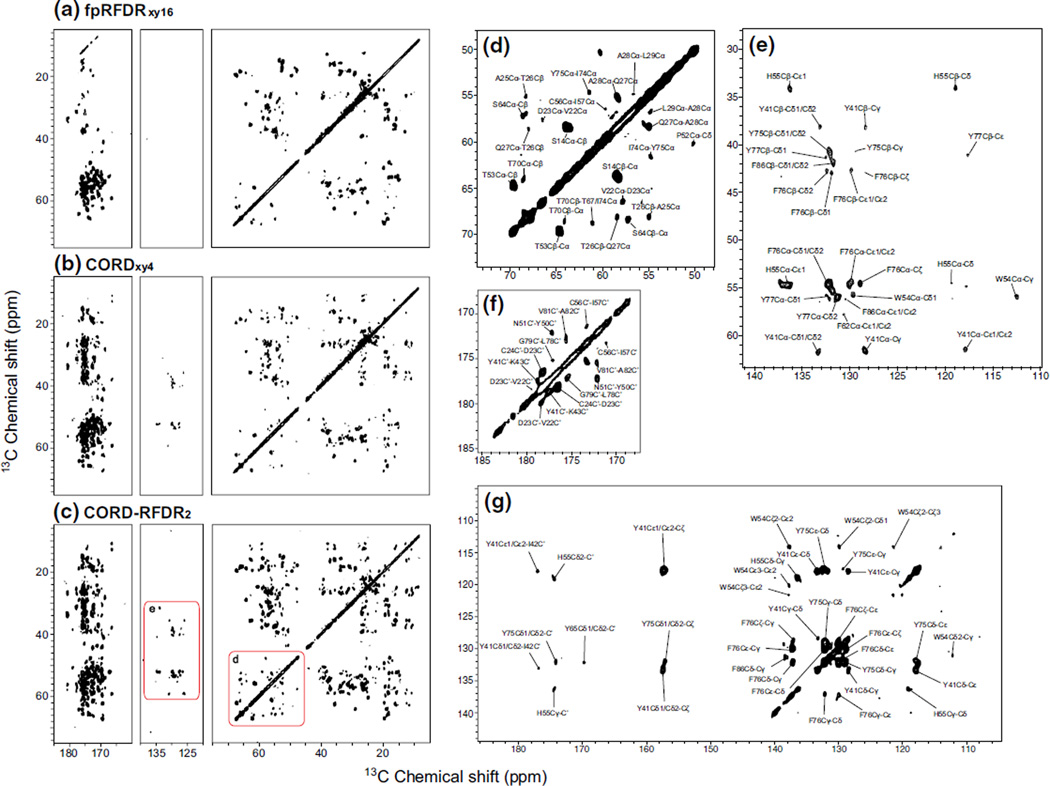
Fig. 5.
2D 13C–13C correlation spectra of U-13C,15N-LC8 protein acquired at the magnetic field of 20.0 T and MAS frequency of 40 kHz with a fpRFDRxy16, b CORDxy4, and c CORD–RFDR. The CORD–RFDR experiment reveals numerous new cross peaks throughout the entire the chemical shift range as compared to fpRFDRxy16 and CORDxy4. The Cα region of the CORD–RFDR spectrum shows numerous inter-residue correlations and the aromatic region displays multiple intra-residue side-chain correlations not present in either the CORD or fpRFDR spectra. Assignments of new cross peaks in the various regions of CORD–RFDR spectrum are shown in the magnified views of: d aliphatic region, e aliphatic–aromatic region, f carbonyl region, and g aromatic–carbonyl region. Most of the carbons for which new cross peaks were observed are separated by 3–5 Å (medium-range distance). Several correlations corresponding to long-range distances have been detected as well. Table 2 summarizes the new correlations detected in the CORD–RFDR spectrum

