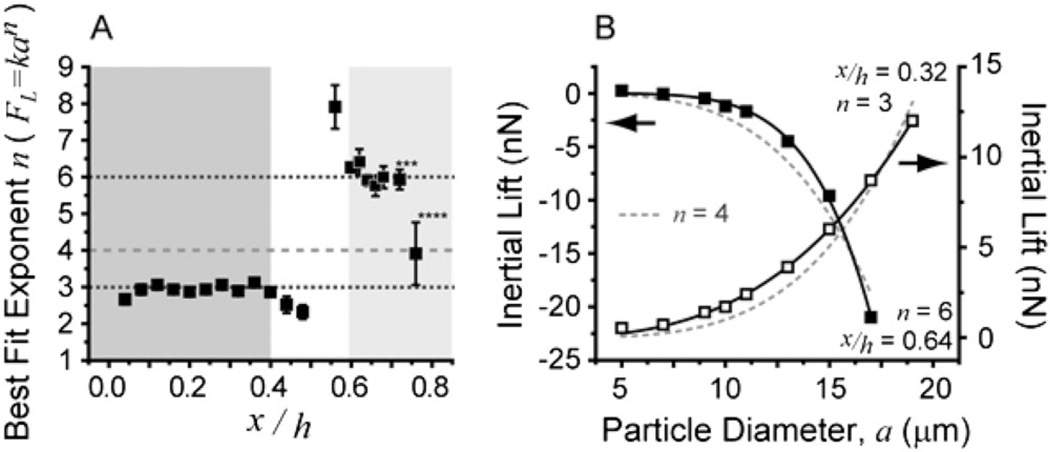
FIG. 4.
Scaling of inertial lift with particle diameter. (a) Best fit exponents are plotted for fits of lift values at nine separate particle diameters from 5 to 19 µm. At large values of x/h, fewer points were used. (***) 6 and (****) 5 points. The near-wall region (light gray) and center region (dark gray) show stable fits at n = 3 and 6, respectively, while a transition region (white) where both effects contribute has divergent scaling. Error bars correspond to error in the fit. (b) Plots of best fits for n = 3 and 6 (solid black line) and fits based on previous asymptotic inertial lift theory of n = 4 (dotted gray line) at two cross-sectional positions.

