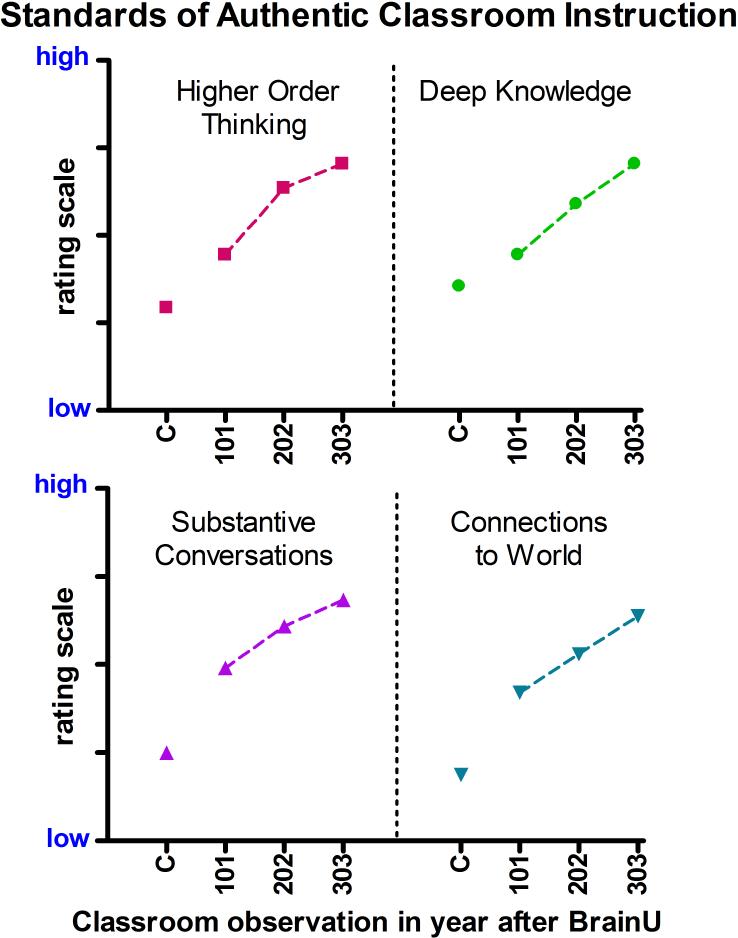
Figure 2.
Classroom observation ratings of Standards of Authentic Classroom Instruction. Average ratings of comparison teachers’ (C) classrooms (N = 12) and BrainU 101, 202 and 303 teachers’ classrooms (N = 46, 28, and 11, respectively). Linear regressions on the mean ratings within each standard produced slopes significantly different from 0. A one-way ANOVA comparing the four regression slopes was not significant, indicating that the increasing ratings across levels of BrainU was comparable for all four measures. After BrainU 101 attendance, performance on all standards except deep knowledge increased compared to controls, with p<0.01 (2-tailed t-test), and with effect sizes (Cohen's d) of 0.74-1.00. The difference was even more striking after BrainU 303, with performance on all standards increasing compared to controls, with p<0.001 on all standards and effect sizes of 1.81-2.23.

