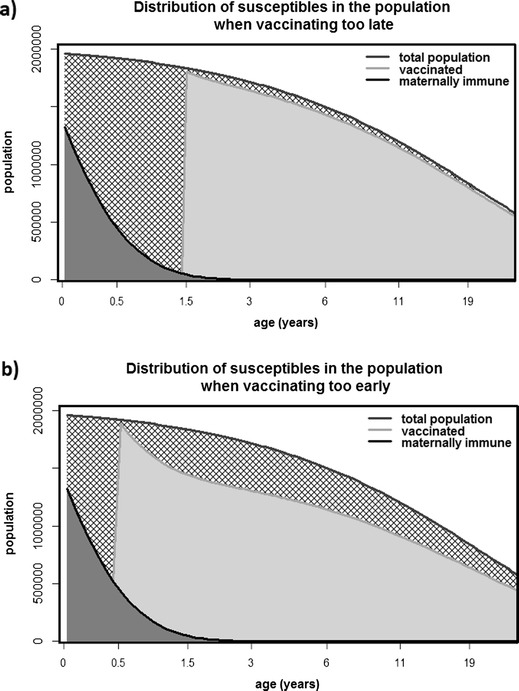
Fig. 1.

Two sample age distributions of immunity within a population. The dark gray region is the portion still maternally immune, the pale gray region is the vaccinated proportion, and the hatched region is the proportion that remains susceptible. The x-axis is shown on a log scale, so the total hatched regions in a and b are of similar area. In a, the vaccine is administered too late, and too many infants remain susceptible. In b, the vaccine is administered too early, so too few doses are effective. Both of these figures use a developing population age structure assuming 6-month maternal immunity
