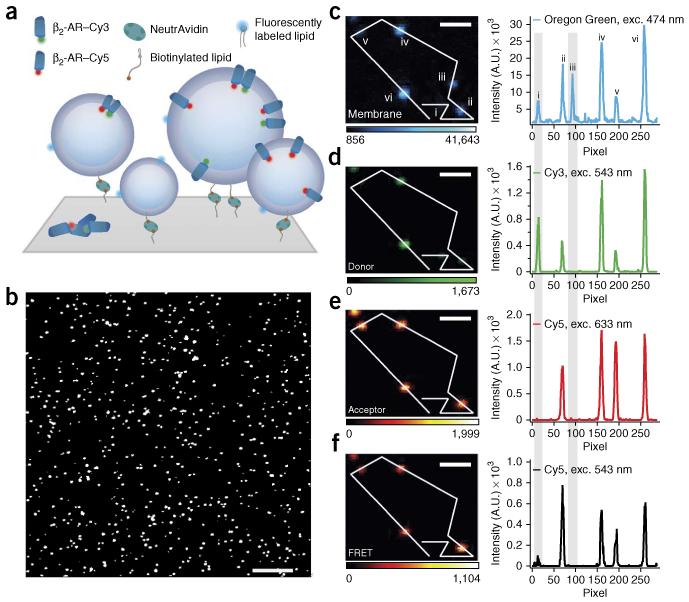
Figure 1.
Surface immobilization and fluorescence microscopy imaging allow for single-proteoliposome characterization. (a) Proteoliposomes tethered through a biotin-NeutrAvidin linker to a polymer-passivated (PLL-g-PEG/PLL-g-PEG-biotin) glass surface. Proteoliposomes are labeled with a lipid-coupled dye (Oregon Green DHPE) and harbor GPCRs labeled with either Cy3 or Cy5 for quantification of receptor oligomerization by FRET. (b–f) Micrographs of typical β2-AR proteoliposome samples with nominal 1:1,000 protein-to-lipid ratio. (b) Magnified version of a typical confocal image. The assay allows high-throughput sampling of ~1,000 proteoliposomes per frame. (c–f) Micrographs and line scans showing high signal to noise for Oregon Green, Cy3, Cy5 and FRET. Gray shading highlights, respectively, an example of a proteoliposomes that carry only donor-labeled receptors (liposome i) and an example of an empty liposome (liposome iii). Exc., excitation wavelength. Color scales represent intensity in arbitrary units. Scale bars, 10 μm (b) and 1.2 μm (c–f).

