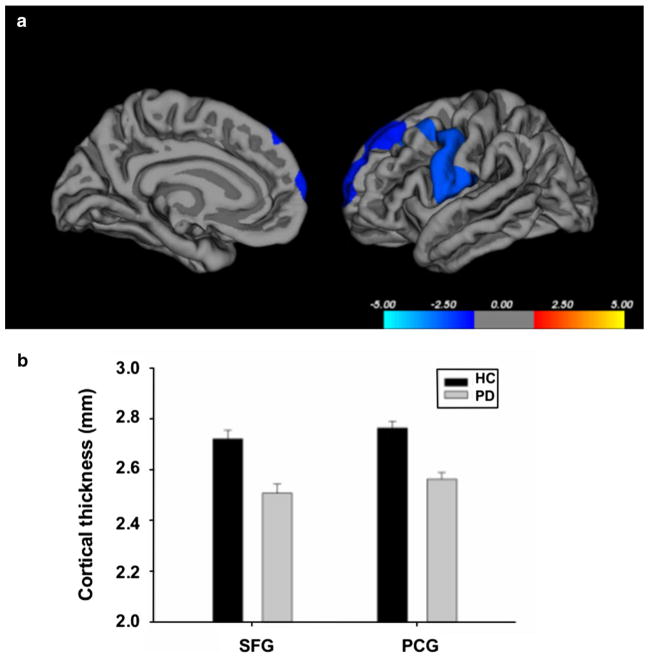
Fig. 1.
a Cortical areas showing significant cortical thinning in patients with Parkinson’s disease compared to healthy controls. Color bar indicates the significance levels in the clusters in Z values. b Bar graphs on extracted cortical thickness values (mm) from the significant clusters in the left superior frontal gyrus (SFG) and left precentral gyrus (PCG) between healthy controls (HC) and PD patients (PD). Error bars represent sem

