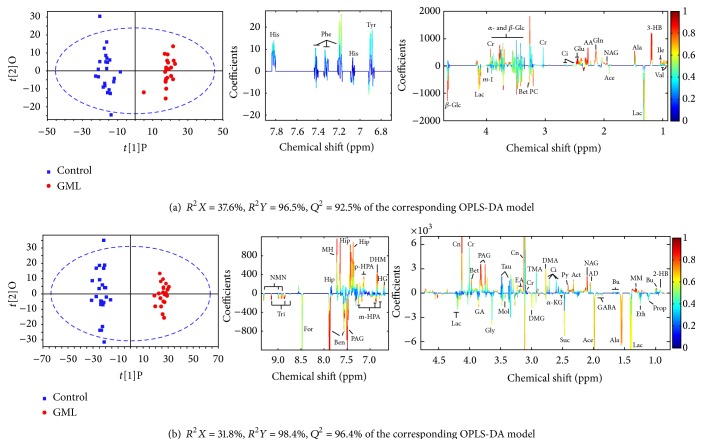
Figure 3.
OPLS-DA score plots (left panel) and the corresponding coefficient loading plots (middle and right panels) derived from NMR data of serum (a) and urine (b) obtained from GML-related dataset (keys: 2-HB: 2-hydroxybutyrate; 3-HB: 3-hydroxybutyrate; AA: acetoacetate; ACh: acetylcholine; Ace: acetate; Act: acetone; AD: acetamide; Ala: alanine; Ben: benzoate; Bet: betaine; Bu: butyrate; Ci: citrate; Cn: creatinine; Cr: creatine; DHM: 3,4-dihydroxymandelate; DMA: dimethylamine; DMG: N,N-dimethylglycine; EA: ethanolamine; Eth: ethanol; For: formate; GA: guanidinoacetate; GABA: gamma-aminobutyrate; Gln: glutamine; Gly: glycine; HG: homogentisate; Hip: hippurate; Ile: isoleucine; α-KG: α-ketoglutarate; Lac: lactate; m-HPA: meta-hydroxyphenylacetate; m-I: myo-inositol; MM: methylmalonate; MH: methylhistidine; MN: 1-methylnicotinamide; Mol: methanol; NAG: N-acetylglutamate; NMN: N-methylnicotinamide; p-HPA: para-hydroxyphenylacetate; PAG: phenylacetylglycine; PC: phosphocholine: Py: pyruvate; Suc: succinate; Tau: taurine; TMA: trimethylamine; Tri: trigonelline; Val: Valine; α-Glc: α-glucose; β-Glc: β-glucose).

