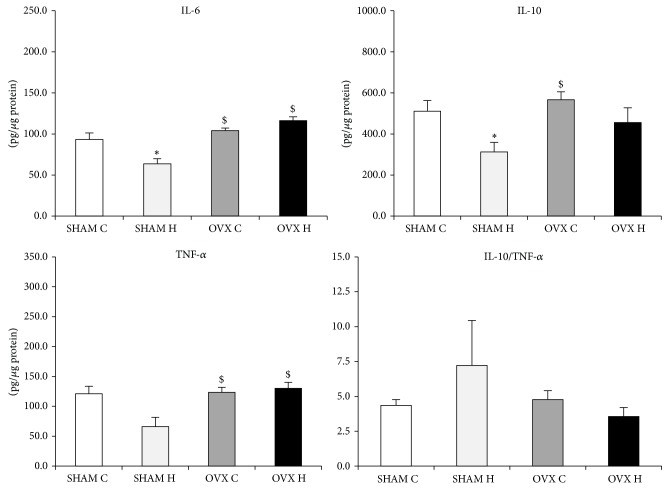
Figure 5.
Retroperitoneal adipose tissue cytokines content of studied rats groups: (SHAM C) sham group treated with control diet; (SHAM H) sham group treated with hyperlipidic diet; (OVX C) ovariectomized group treated with control diet; (OVX H) ovariectomized group treated with hyperlipidic diet. The numbers of samples varied between six and eight. ∗ P < 0.05 as compared to the SHAM C; # P < 0.05 as compared to OVX H; $ P < 0.05 as compared to SHAM H.

