Figure 2.
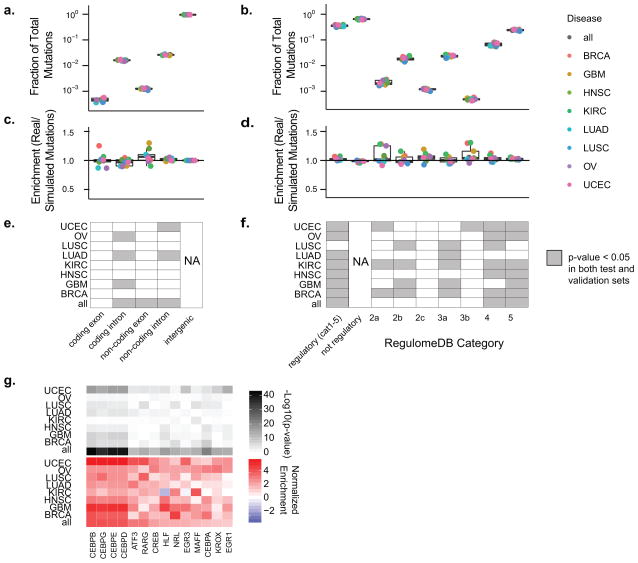
Global Analysis of Mutations in Coding and Regulatory Regions (A) Boxplots of the frequency relative to all mutations for each Gencode transcript region type are shown for each cancer type. Overlaid points represent each cancer type. (B) Similar to (A), boxplots of mutations pooled by cancer type are shown for regulatory and non-regulatory regions. Regulatory categories shown are from RegulomeDB. (C) Boxplots depict enrichment analysis of real mutations compared to simulated mutations in various Gencode transcript regions. (D) Similar to (C), boxplots depict enrichment analysis of regulatory region real mutations compared to simulated mutations for mutations annotated with various RegulomeDB scores. (E&F) Plots of sample and annotation (GENCODE transcript region in E and RegulomeDB score in F) pairs with a significant enrichment or depletion in real versus simulated mutations compared to intergenic regions (E) and not regulatory regions (F). Gray denotes P value (two-sided Fisher’s exact test) less than 0.05 in both test and validation sets. (G) Heatmaps of add-one smoothed enrichment and −log10(p-values) (two-sided Fisher’s exact test) are shown for pairs of cancer type and mutations subcategorized by transcription factor binding sites. Only factors that pass significance (FDR < 0.001) in the combined set of all cancer types for test and train are shown.

