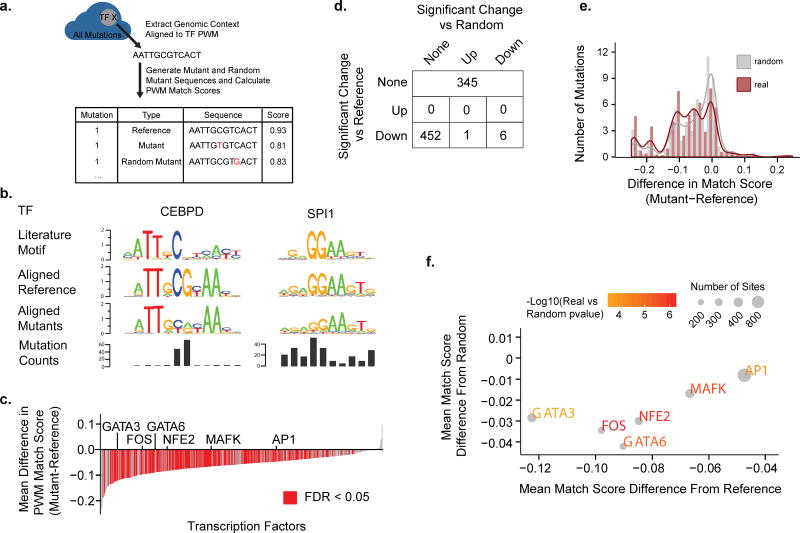
Figure 3.
Effects of Mutations on Transcription Factor Binding Sites (A) An illustration is shown describing the methodology of aligning and generating match scores for mutations contained within transcription factor binding sites. (B) Mutated regions for each transcription factor were aligned to the factor’s PWM and sequence logos were generated. Sequence logos for the literature motif, the aligned reference, and the aligned mutant sequences as well as the mutation counts at each position are shown for two representative transcription factors (CEBPD and SPI1). (C) For each transcription factor the match score to the transcription factor PWM was determined for all the factors mutated sites. Plotted is the mean difference in the match score (y-axis) for each transcription factor (x-axis) between the mutated sites and the reference. Red indicates FDR<0.05. P-value computed by two-sided paired Wilcoxon rank-sum test. (D) A table showing the breakdown of transcription factors that contain sites with match scores that are significantly different than reference and/or significantly different than those of random mutations. (E) A histogram of pooled match scores of factors that are significantly worse than reference and worse than random. (F) For each transcription factor with a significantly worse match score than reference and random the mean difference between the mutant sites and reference (x-axis) is plotted against the mean difference between the mutant sites and random mutant sites (y-axis). The color of the text scales with the −log10(p-value) of the real versus random scores and the size of the point scales with the number of mutant sites.

