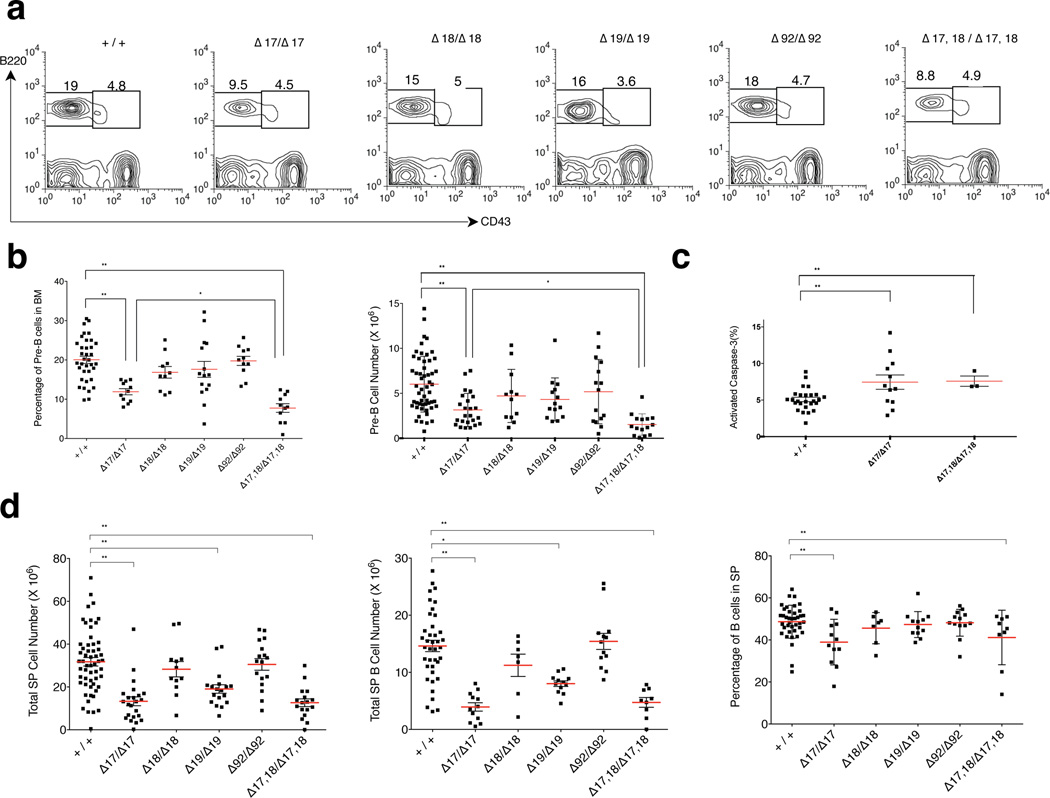
Figure 4. Analysis of B-cell development in the miR-17~92 allelic series.
(a) Flow cytometry plots showing the percentage of bone marrow pro- (IgM−, B220+, CD43+) and pre-B cells (IgM−, B220+, CD43−) in 5–6-week-old wild type and homozygous mutant mice. (b) Quantification of the pre-B-cell percentage and absolute pre-B cell number (n > 10). (c) Percentage of cleaved caspase-3 positive pre-B-cells in 5–6-week-old wild type, miR-17~92Δ17/Δ17 and miR-17~92Δ17,18/Δ17,18 animals (n > 3). (d) Total number of splenocytes and B-cells as well as percentage of B-cells in the spleen. Red bars indicate average. * p < 0.05, ** p < 0.001, 2-tailed t-test.

