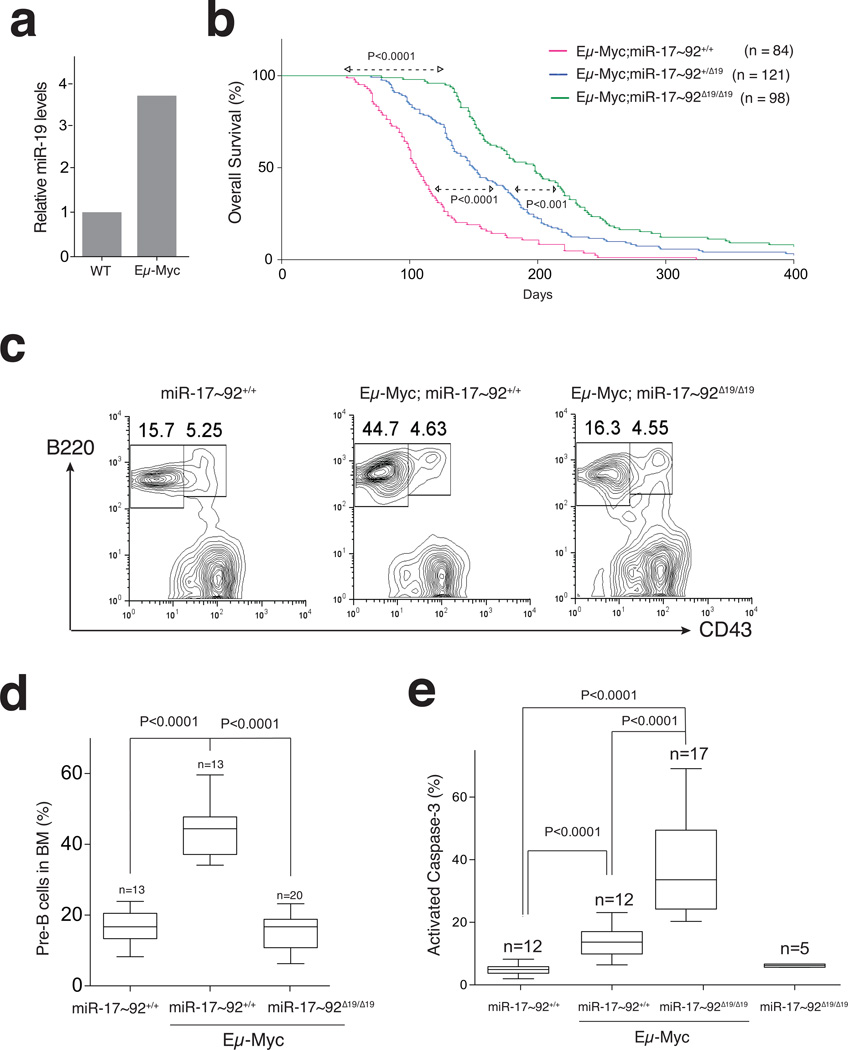
Figure 5. Impaired Myc-driven lymphomagenesis in miR-19-deficient mice.
(a) Expression of miR-19b in pre-B-cells from 5 week-old wild type and Eμ-Myc mice (RT-qPCR; p < 0.01; 2-tailed t-test). (b) Kaplan-Meier plots of Eμ-Myc carrying the indicated miR-17~92 alelles. (p-values: Mantel-Cox test). (c) Representative FACS and (d) Box and whiskers plots showing the fraction of pre-B-cells in the bone marrow of 5 week-old mice. (e) Box and whiskers plots showing the percentage of cleaved caspase-3 positive pre-B-cells (median, 25th and 75th percentiles, and min and max values are plotted; p-values: 2-tailed t-test; Error bars: s.d.).

