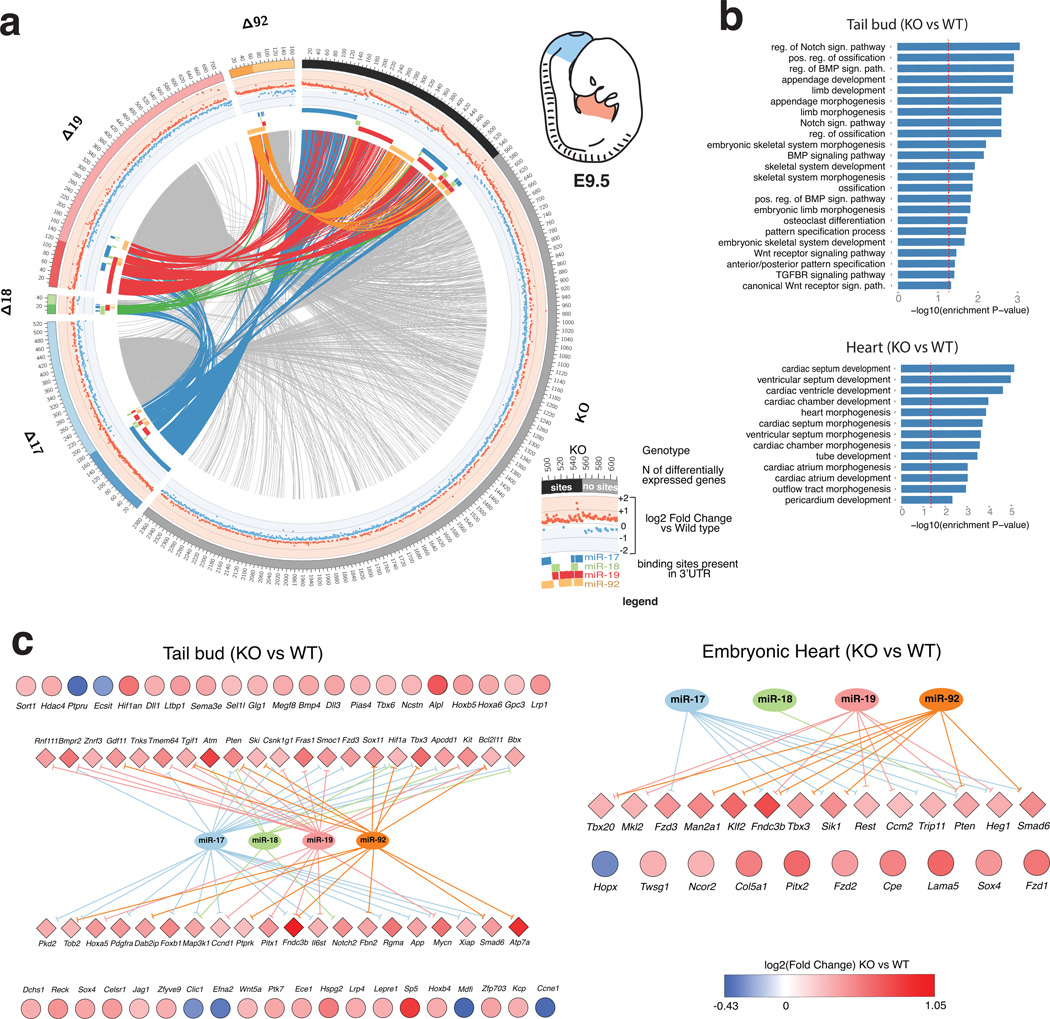
Figure 6. Genome-wide identification of genes regulated by members of the miR-17~92 cluster.
(a) Circos plot of differentially expressed genes (FDR <= 0.1) in the tail bud of miR-17~92 mutants embryos. Each sector of the plot correspond to a different miR-17~92 mutant allele. To reduce complexity, only the complete knock-out (KO) and the four single-seed mutant alleles are shown (for additional Circos plots—including ones generated from the heart dataset—see Supplementary Figure 8–11). Genes with predicted binding sites for one or more of the deleted miRNAs are grouped under the darker portion of each sector. A scatter plot of the log2 fold-change is presented in the intermediate circle, with up- and down-regulated genes labeled in red and blue, respectively. Presence of predicted binding sites for the various components of miR-17~92 is indicated by a colored bar in the inner circle. Genes differentially expressed in more than one genotype are joined by links. Links are colored if the gene has predicted binding sites for miR-17~92, otherwise they are shown in light gray. (b) Bar plot of GO terms enriched among the most significant differentially expressed genes (FDR <= 0.01 and |og2 FC >= 0.26) in miR-17~92Δ/Δ tail bud (top) or heart (bottom). Only terms relevant to cardiac or skeletal development are shown. A red dashed vertical line indicates marks a nominal enrichment p-Value of 0.05. (c) Genes contributing to the enriched GO terms shown in (b). Diamonds indicate predicted miR-17~92 targets, circles indicate presumed indirect targets. Color reflects the log2 FC value.

