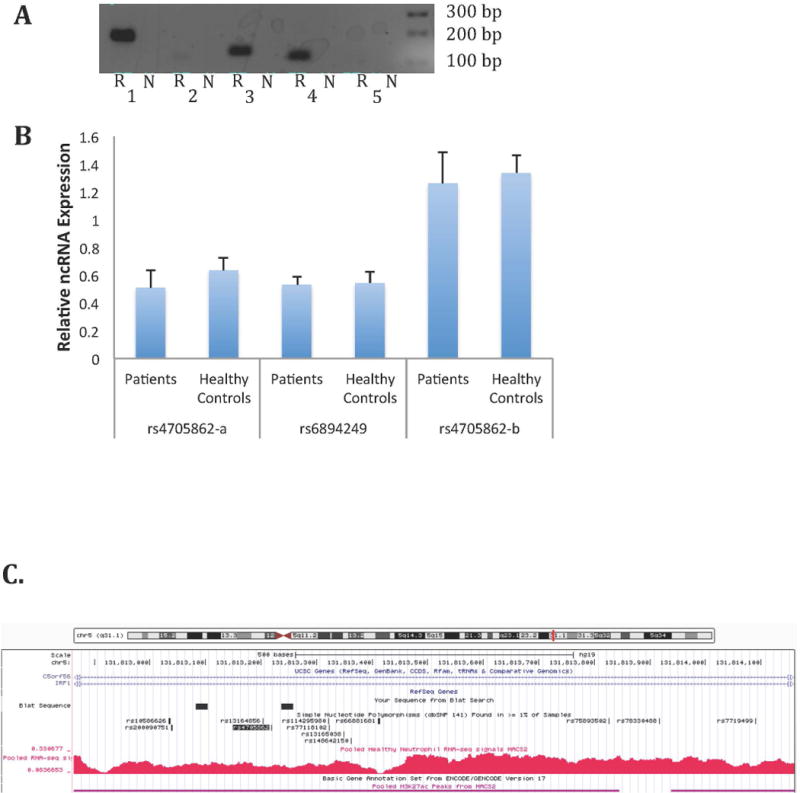
Figure 4. Corroboration of the presence of non-coding RNAs expressed in neutrophils.

A: Agarose gel image of qualitative PCR amplification of non-coding RNA in neutrophils. “N” indicates the control sample in which neutrophil RNA was not subjected to reverse transcription; “R” indicates samples that were subjected to reverse transcription prior to amplification as described in the Methods section. 1. rs4705862-a. 2. rs72698115. 3. rs6894249. 4. rs4705862-b. 5. rs27290. B: Relative non-coding RNA abundance in neutrophils from JIA patients (n=8) and healthy controls (n=8). Statistical analysis was performed on ΔCt values using unpaired t-tests. Values are the mean ± SEM. P>0.05 verse healthy controls for all three ncRNA transcripts. C. Provides a view from the UCSC Genome Browser demonstrating abundant transcription located adjacent to the rs4705862 SNP, which is located in an intergenic region between the C5orf56 and IRF1 genes. The black boxes indicate the location of the region amplified by the primers in Lane 1 (rs4705862-a). The primers for the rs4705862-b transcript (Lane 4) were located internal to the rs4705862-a transcript. Note abundant transcription that may represent more than one non-coding transcript. Regions also displaying H3K27ac-marked enhancers are shown with the horizontal purple lines. The rs4705862 SNP is indicated by the shaded black text.
