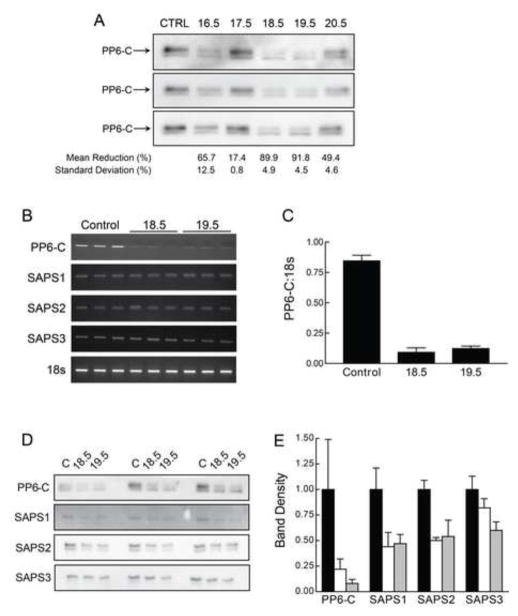
Figure 1. PP6-C, SAPS1, SAPS2, and SAPS3 mRNA and protein content in control and PP6KD cells.
A. Cell lysates were prepared from control transduced cells and five cell lines that were transduced with shRNA targeting PP6-C. Western immunoblotting performed on triplicate samples was used to calculate the mean and standard deviation for the reduction in PP6-C protein content. B. Triplicate total RNA samples from control transduced and the 18.5 and 19.5 PP6KD HepG2 cell lines were analyzed by RT-PCR for PP6-C, the three SAPS and 18s ribosomal RNA. The resulting ethidium bromide-stained gels are shown. C. The results for PP6-C and 18s were quantified by densitometry and expressed as the ratio of PP6-C to 18s (mean and standard deviation of the triplicate analyses). D. Triplicate lysates from control transduced and the 18.5 and 19.5 PP6KD cell lines were analyzed by immunoblotting for PP6-C and the three SAPS. E. The gels shown in Panel D were analyzed by densitometry. Results were normalized to the mean intensity for the triplicate controls and expressed as the mean and standard deviation. Black bars, control cells; white bars, 18.5; gray bars, 19.5.

