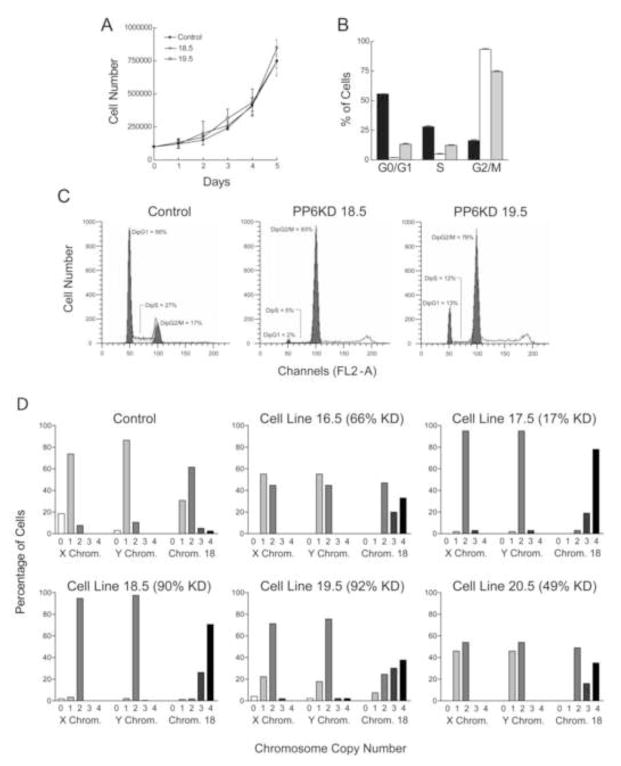
Figure 3. Proliferation and cell cycle kinetics of control and PP6KD cells.
A. Growth rate was measured for the control and two PP6KD cell lines. Data are given as mean±standard deviation of 6 replicate determinations. B. The percent of cells in each of three cell cycle phases, G0/G1, S and G2/M, was determined using flow cytometry. Triplicate analyses were performed using control cells (black bars) and the two PP6KD cell lines (18.5, white bars; 19.5, gray bars). Data are shown as the mean plus standard deviation. C. Representative flow cytometry profiles are shown for each of the three cell lines. D. Fluorescent in situ hybridization was used to determine the copy number in each individual cell for the X and Y chromosomes and chromosome 18. Data are shown for the control cells and the five PP6KD cell lines. The percent reduction in PP6-C, taken from the experiment in Figure 1, is given next to the cell line identification in each graph. The numbers below the bars represent the mean number of copies of each chromosome in the particular cell line.

