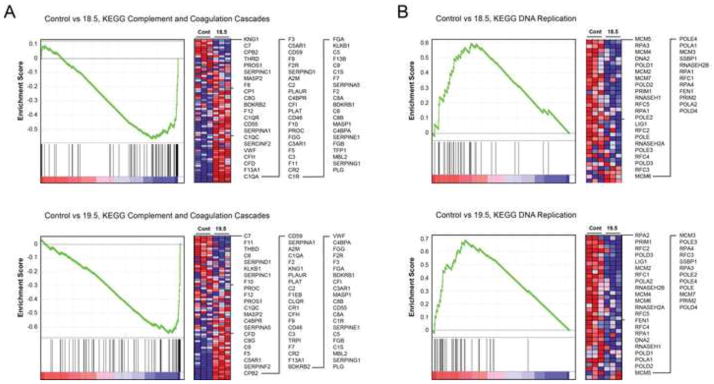
Figure 5. Gene set enrichment analysis of gene expression in the control and PP6KD cell lines.

Results are shown for two gene sets, Complement and Coagulation Cascades (A) and DNA replication (B). The graphs show the hierarchical ordering of enrichment scores. The intensity of the genes accounting for these data is depicted in the heat maps. Red and blue reflect high and low gene expression, respectively. Individual genes corresponding to rows in the heat map are shown to the right in each panel.
