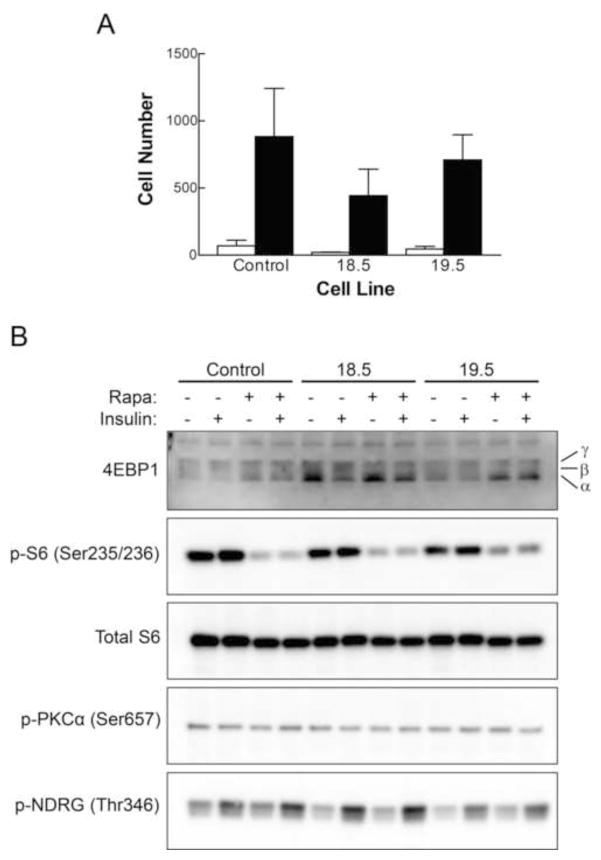
Figure 7. Further characterization of the PP6KD cell lines.
A. Cell migration was measured as the number of cells that moved to the void area of a migration chamber over a period of 48 hr. Control measurements (white bars) and experimental results (black bars) are shown for each of the three cell lines as the mean plus standard deviation for triplicate determinations. B. Control and PP6KD cells, as indicated at the top of the panel, were exposed to 100 nM rapamycin for 1 hr prior to preparation of cell lysates, 100 nM insulin for 30 min, neither, or both. Samples were prepared in triplicate and analyzed by Western immunoblotting. One set of samples that is representative is shown. The α, β and γ designations to the right of the 4EBP1 blot represent the positions of the hypo-, intermediate and hyperphosphorylated forms of the protein, respectively.

