
Figure 1. Gene Set Enrichment Analyses.
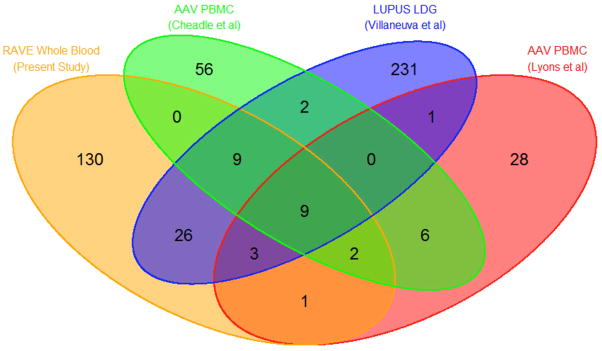
Venn diagram illustrates overlap in the number of differentially expressed genes identified in four independent datasets. The RAVE dataset compared whole blood gene expression between treatment responders and nonresponders in ANCA-associated vasculitis (AAV). The Cheadle and Lyons studies compared expression in PBMCs between patients with AAV and healthy controls (33,34). The Villanueva et al study compared expression between LDGs and autologous normal-density neutrophils in patients with SLE (25). Overlapping ovals indicates the number of common genes shared between datasets.