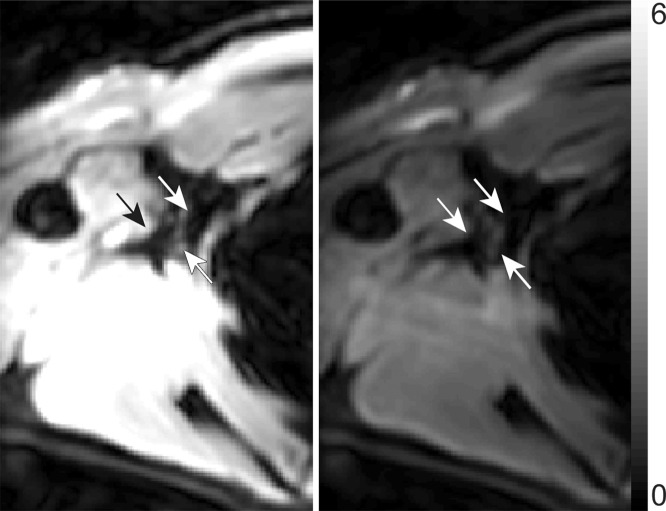
Figure 1d:
Relaxation time measurements. Graphs of (a) inversion recovery and (b) exponential spin-echo decay of a representative lymphatic fluid sample at 38°C. Experimental data (●) and fit (solid line) are shown (Equations 1 and 2, respectively). (c, d) In vivo MR images of lymph nodes (arrows) acquired with (c) DWIBS and (d) without (left) and with (right) inversion prepulse with echo-planar imaging. Inversion prepulse was placed at the expected null point (inversion time, 1.4 sec; repetition time, 4 sec) of lymphatic water, calculated with T1 of 3100 msec measured from the ex vivo lymphatic sample. (e) Quantitative analysis of signal in the nodes shows that signal intensity after longitudinal nulling is not significantly different from noise signal. This provides support for the ex vivo T1 measurements reflecting in vivo lymphatic water T1. Red line represents the median, while the box represents the 25th and 75th percentiles. Error bars indicate the most extreme values in the data. * * * = P < .001.

