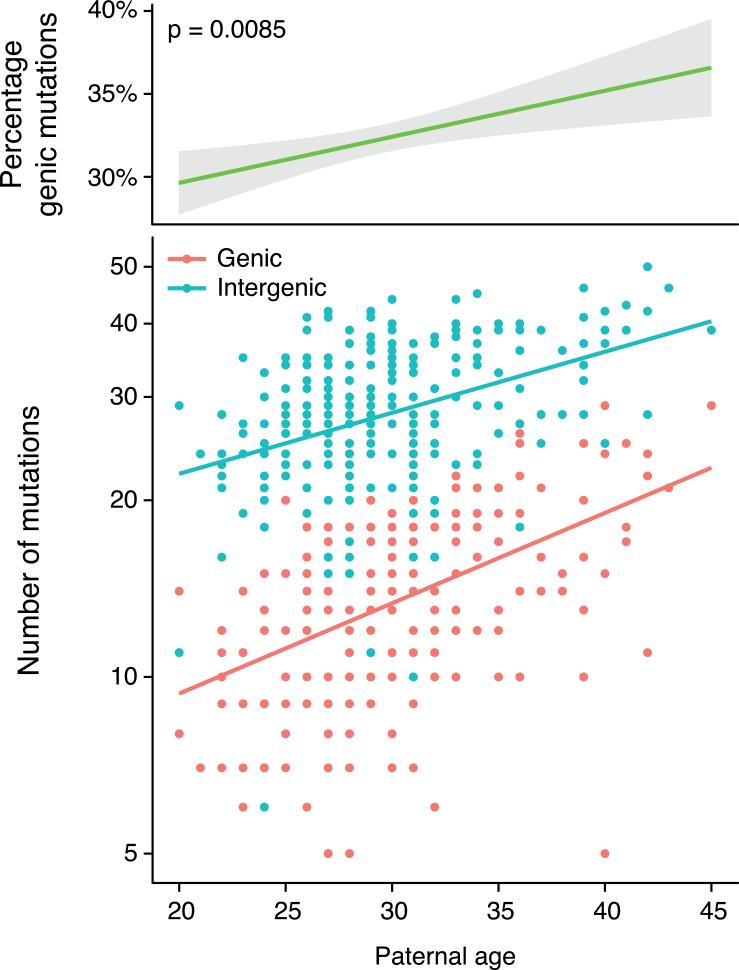
Fig. 2. Offspring of older fathers harbor a higher percentage of de novo mutations in genes.
Top panel: the percentage of de novo mutations within genic regions as a function of paternal age at conception (p = 0.0085, slope = 0.26% per year of paternal age).
Bottom panel: the number of genic (red) and intergenic (blue) de novo mutations in offspring (on a logarithmic scale) as a function of paternal age. The red line shows the least-square regression for genic mutations (p < 2 × 10⁻¹⁶), the blue line for intergenic mutations (p = 3.7 × 10⁻¹⁴). The steeper slope of the regression line for genic mutations indicates a faster relative increase in genic than intergenic mutations with paternal age.

