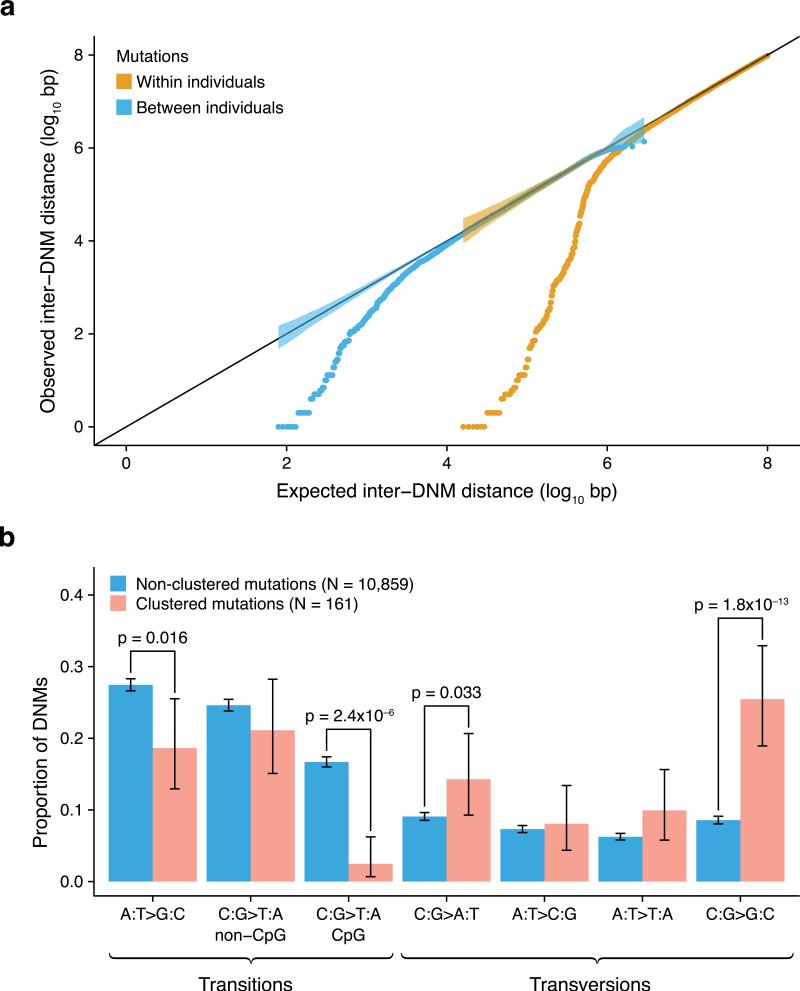
Fig. 3. Mutation clusters exhibit a unique mutational spectrum.
a. The distances between adjacent de novo mutations (observed) compared to a uniform distribution of mutations across the genome (expected). Closely spaced mutations are enriched both across individuals (brown) and within individuals (blue). The strength of this effect is strongest within individuals, where 78 mutation clusters of up to 20kb in size are observed. In fact, 1.5% of all de novo mutations in our study are in such clusters. Shaded areas represent the 95% confidence intervals.
b. Comparison of mutation spectra between clustered (pink) and non-clustered (blue) de novo mutations (error bars indicate 95% CI). We defined mutation clusters as regions with two or more mutations within 20kb in the same individual. Mutations within clusters show a significantly reduced number of transitions (p = 1.2 × 10⁻¹² for all transitions, p = 4.1 × 10⁻⁶ when excluding C>T transitions at CpG sites) and a strongly elevated number of C→G transversions (p = 1.8 × 10⁻¹³), indicating a novel mutational mechanism.

