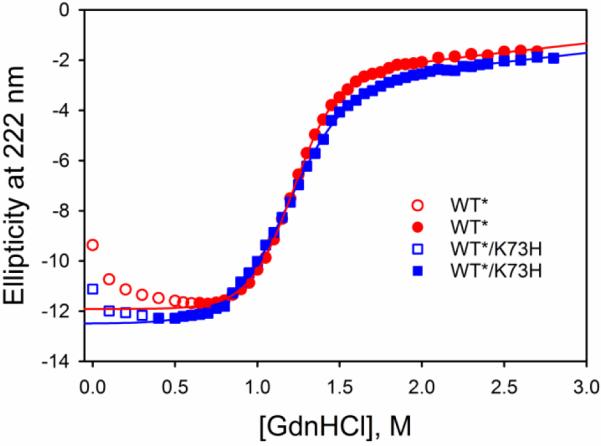
Fig. 2.

GdnHCl denaturation curves for the WT* (red circles) and WT*/K73H (blue squares) variants of iso-1-Cytc. Unfolding was monitored at 222 nm as GdnHCl was titrated into iso-1-Cytc buffered with 40 mM NaCl, 20 mM Tris buffer, pH 7.5 at 25 °C. Data in open symbols were not included in the fit to a two-state model (solid curves), described in the Materials and methods.
