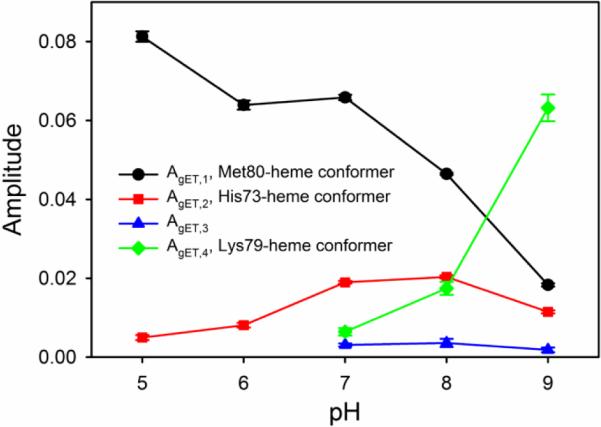
Fig. 5.

Amplitude data vs pH from gated ET experiments on WT*/K73H. Amplitude values correspond to the change in absorbance at 550 nm. Concentrations of a6Ru2+ for AgET,1 (black circles and line) and AgET,2 (red squares and line) for pH 5, 6, 7, 8 and 9 were 2.8, 3.0, 3.7, 3.9 and 2.8 mM, respectively. AgET,1 and AgET,2 are both from short (1 to 5 s) data acquisitions, Concentrations of a6Ru2+ for AgET,3 (blue triangles and line) and AgET,4 (green diamonds and line) for pH 7, 8 and 9 were 1.9, 2.24 and 1.78 mM, respectively. AgET,3 and AgET,4 are both from long timescale (150 to 300 s) data acquisitions. Error bars are the standard deviation of the average.
