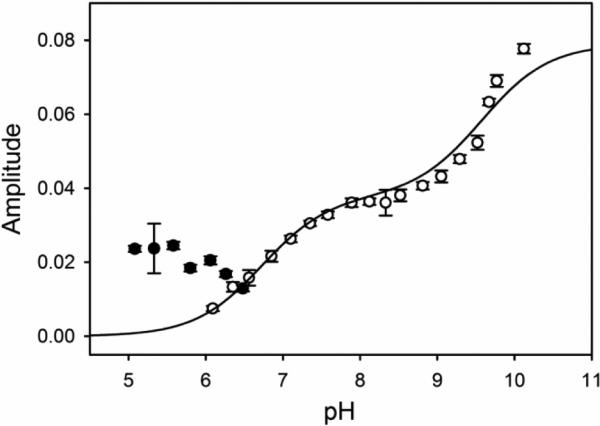
Fig. 7.

Amplitude versus pH for the fast phase (kobs,1) from pH jump stopped-flow experiments. Amplitudes correspond to the change in absorbance at 406 nm. Upward (open circles) pH jump amplitudes are fit to Eq. 4 in the Discussion, derived from the kinetic scheme in Fig. 6b [23, 30]. The fit yields CT equal to 0.164 ± 0.009. Downward pH jump amplitudes (filled black circles) are not used in the fit. Error bars on data points are the standard deviation of the average.
