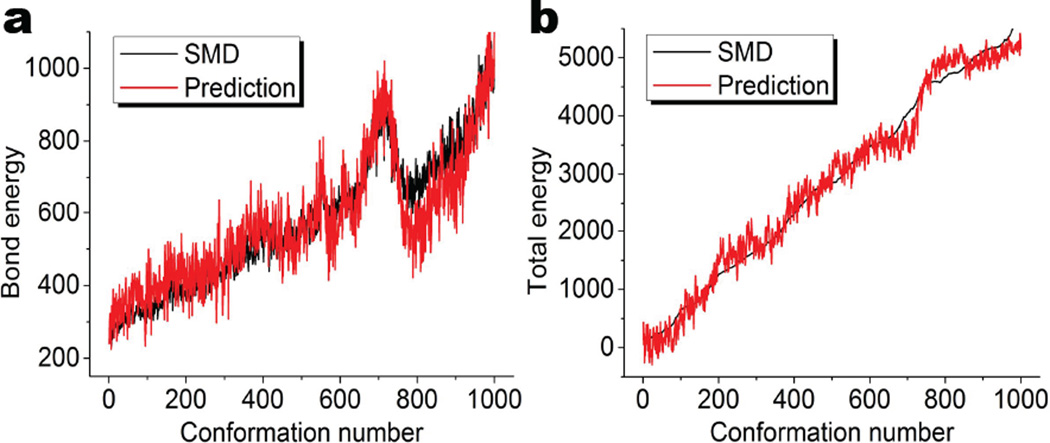
Figure 4.
The prediction of bond and total energy with β0 and β1 accumulated bar lengths, respectively. a The quantitative comparison of bond energies of β0 predictions and steered molecular dynamic results. The horizontal axis labels the configuration number and the vertical axis is the bond energy (kcal/mol). The Pearson’s correlation coefficient is 0.924. b The comparison of total energies of β1 predictions and steered molecular dynamic results. The horizontal axis labels the configuration number and the vertical axis is the total energy (kcal/mol). The Pearson’s correlation coefficient is 0.990. The accumulated bar length for each configuration is calculated by the summation of all the corresponding PBNs for the configuration. It can been seen these topological measurements capture the essential properties of the bond and total energies, and thus can be used to characterize the unfolding process.

