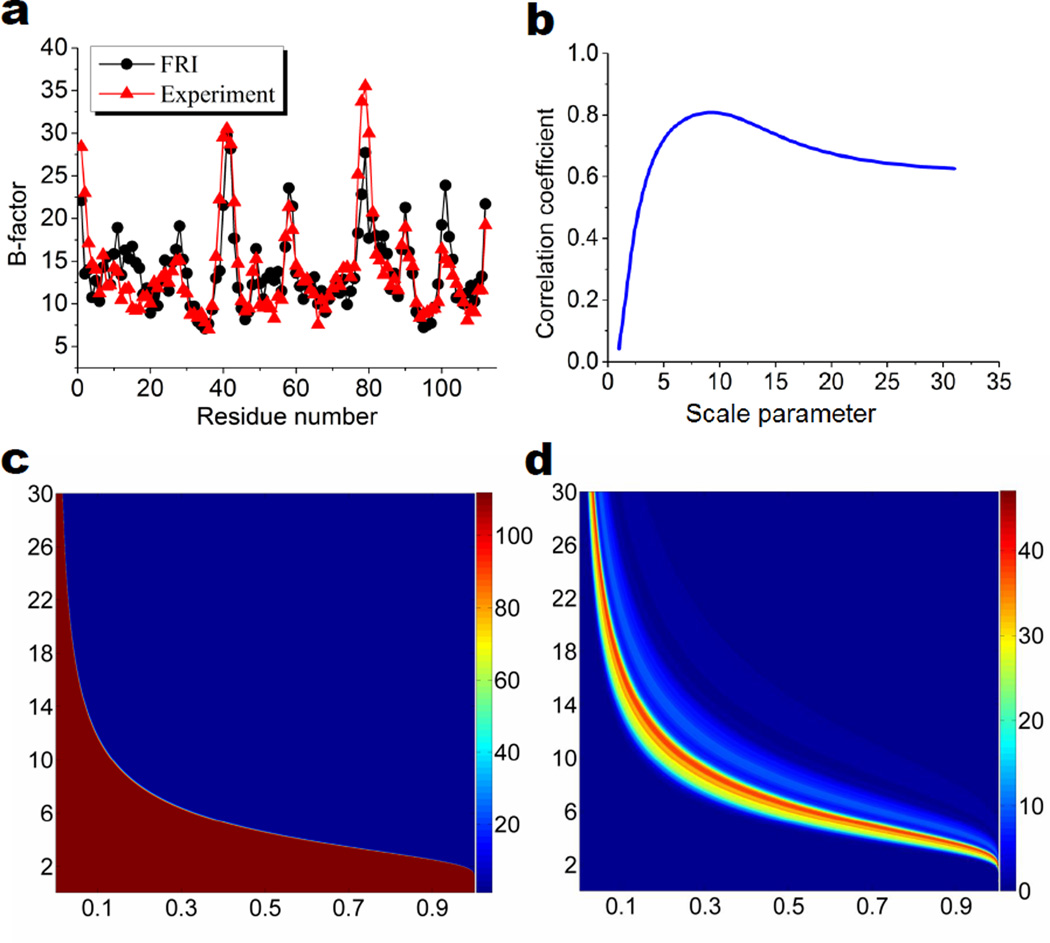
Figure 6.
Performance of the FRI and multidimensional persistence of protein 2MCM. a Comparison of the FRI prediction at σ = 9.2Å and experimental B-factors; b Correlation coefficient vs scale (σ) for the FRI; c 2D β0 persistence; d 2D β1 persistence. In c and d, the horizontal axis is in the FRI filtration matrix value Mij (8) and the vertical axis is the scale (σ) in terms of Å in the FRI. The color bars represent PBNs.

