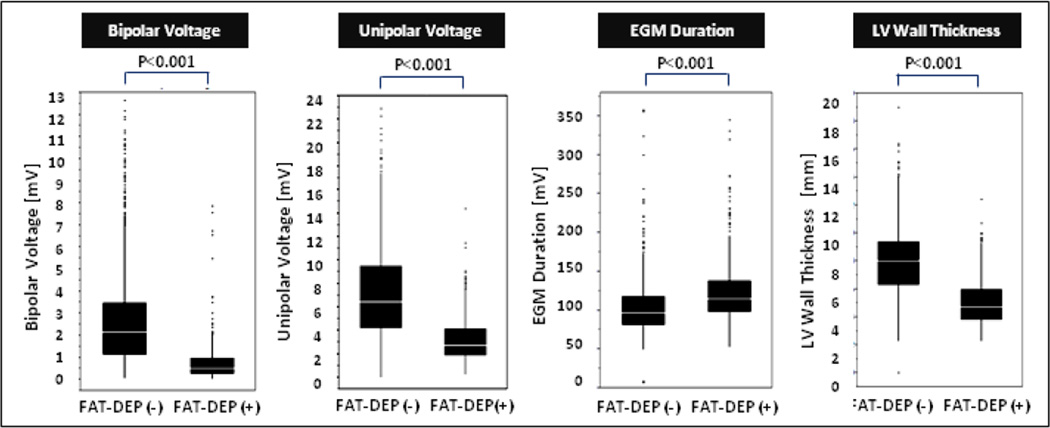
Figure 3. Comparison of Electrogram Characteristics between the Sectors with and without FAT-DEP.
electrogram parameters between the CE-CT sectors with and without FAT-DEP were compared with boxplot graphs demonstrating the median (white line), interquartile range (solid box), range (black line), and outliers. Abbreviations as in Figure 1.

